






Epitope Identification from PhIP-Seq Raw Data
Introduction
A PhIP-Seq project often ends with FASTQ files, count tables, and a long list of enriched peptides. The experimental question, however, is usually narrower: which peptide regions represent real epitope candidates, and which high-read entries are background, library imbalance, or sample-specific noise? Serum antibody reactivity is present in the raw data, but epitope identification requires mapping, normalization, background filtering, tiled-region review, and candidate prioritization before any peptide can be treated as a mapped epitope.
Epitope identification from PhIP-Seq raw data is difficult because sequencing readouts combine biological signal with technical structure. Input library clones are not equally represented. Some peptides bind beads or capture reagents nonspecifically. Batch effects, low mapping rates, or missing controls can all create apparent enrichment that does not reflect antibody-specific recognition. Reliable epitope calling depends on separating technical artifacts from reproducible peptide enrichment patterns.
For teams moving from raw sequencing output to epitope shortlists, the analysis workflow should be defined before candidate peptides are sent to validation assays.
What Raw PhIP-Seq Data Can and Cannot Report
Raw PhIP-Seq data report peptide clone counts after immunoprecipitation and sequencing. They do not directly report confirmed epitopes, diagnostic targets, or protein-level binding sites. Each read count must be mapped to a peptide identity, compared with input library representation, filtered against background controls, and interpreted in the context of library tiling before an epitope region can be proposed.
In epitope identification workflows, the analysis unit is usually the enriched peptide or tiled peptide region. When the library spans a protein sequence with overlapping peptides, adjacent enriched tiles can support localization of a linear epitope region. Isolated single-peptide enrichment may still be meaningful, but it requires stronger background review and replicate support than contiguous tiled signals.
Raw data can support epitope discovery when the library annotation, controls, and cohort design are complete. Without those elements, high read counts remain ambiguous enrichment events rather than epitope assignments.
Core Inputs Required for Epitope Analysis
Epitope identification from PhIP-Seq raw data typically starts with three input layers.
Sequencing reads come from immunoprecipitated phage DNA and must be mapped to the peptide library used in the experiment. Library annotation links each clone or barcode to a peptide sequence, antigen source, protein coordinate, or tiled region. Experimental metadata record sample groups, control types, replicate numbers, batch information, and time points.
Analysis should not begin until the following materials are confirmed:
- raw sequencing reads in FASTQ or equivalent format
- peptide library reference and annotation matched to the experiment
- input library sequencing data
- no-serum, bead-only, or other negative control data
- biological group labels and technical replicate information
- sample collection, storage, and processing metadata
If the library reference does not match the library used in the experiment, epitope mapping will fail even when read depth is high.
Step 1: Read Quality Control and Library Mapping
Read processing is the first analytical gate for epitope identification. Low-quality reads, adapter contamination, truncated sequences, and abnormal read composition should be filtered or flagged before mapping. Clean reads are then aligned to the peptide library reference so each count can be assigned to a peptide clone or annotated region.
Mapping quality affects every downstream epitope call. Low overall mapping rate may indicate sequencing problems, reference mismatch, library contamination, or insert failure. Extreme dominance by a small number of clones may reflect amplification bias rather than antibody-driven enrichment.
|
QC Check |
What to Review |
Impact on Epitope Identification |
|---|---|---|
|
Read quality |
Base quality, adapter content, read length |
Poor reads reduce mapping accuracy |
|
Mapping rate |
Fraction of reads assigned to library peptides |
Low mapping weakens enrichment estimates |
|
Peptide coverage |
Number of library clones detected |
Missing clones create false negatives |
|
Input distribution |
Starting abundance across library clones |
Input imbalance can mimic enrichment |
Step 2: Build the Count Matrix
After mapping, counts are organized into a matrix in which rows represent peptides or tiled regions and columns represent samples, controls, or input library runs. Each value reflects how many reads were assigned to a peptide in a given sample.
Raw counts should not be used directly for epitope ranking. Read totals are influenced by sequencing depth, input clone abundance, immunoprecipitation recovery, and background binding. A peptide with many reads in one sample may still be unremarkable if the same peptide is abundant in the input library or negative controls.
A practical count matrix should retain these fields:
- peptide sequence and clone identifier
- source antigen, protein, pathogen, or proteome region
- library tiling position when applicable
- sample group and control labels
- replicate and batch identifiers
Standard Analysis Workflow for Epitope Identification
A complete epitope identification workflow moves from raw reads to a validated shortlist through six linked stages.
Read QC and mapping assign sequencing counts to peptide identities. Count matrix construction organizes sample-level peptide representation. Normalization and background filtering reduce depth bias, input imbalance, and nonspecific binding artifacts. Enrichment analysis identifies peptides or regions elevated above input and controls. Tiled-region review groups adjacent enriched peptides into candidate linear epitope intervals. Candidate prioritization produces a shortlist for peptide array, ELISA, or protein-level confirmation.
Teams that skip tiled-region review often overinterpret isolated single peptides while missing broader epitope intervals supported by overlapping enrichment.
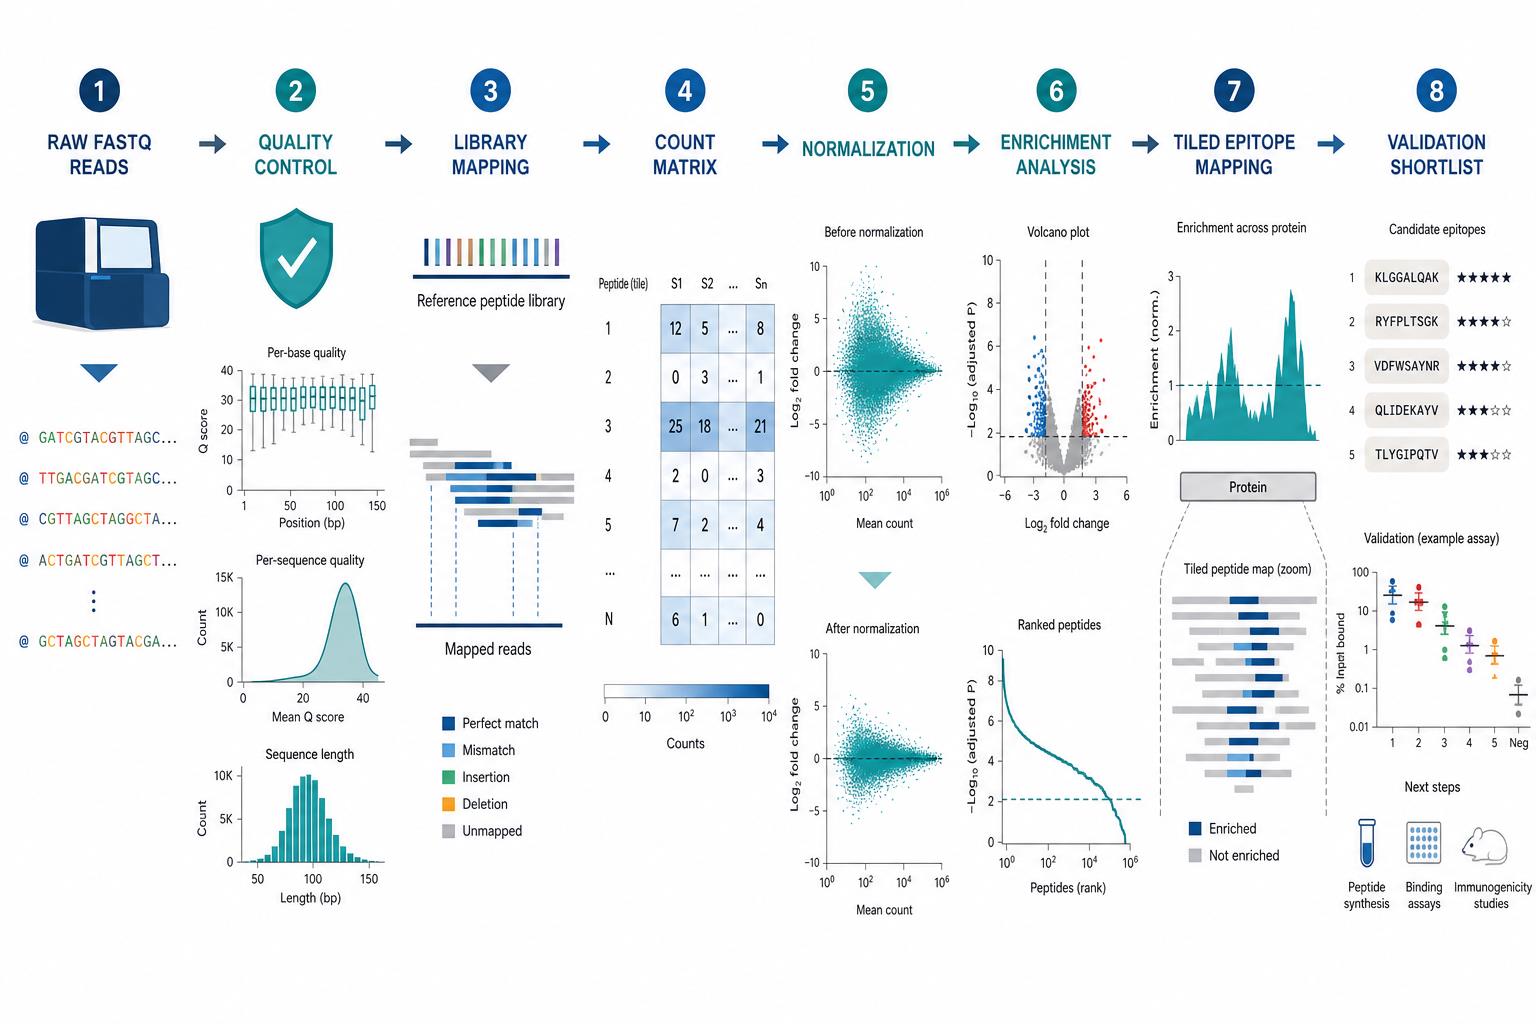
Figure 1. Epitope identification from PhIP-Seq raw data requires read mapping, count normalization, background filtering, enrichment analysis, and tiled-region review before candidate validation.
Related Services
PhIP-Seq Antibody Analysis Service
Antibody Epitope Mapping Service
Peptide Array-Based Epitope Mapping Service
High-Throughput Peptide Epitope Mapping Service
Researchers interpreting PhIP-Seq raw data can consult MtoZ Biolabs to review mapping quality, enrichment logic, and the validation path best suited to shortlisted epitope candidates.
Step 3: Normalization and Background Filtering
Normalization makes samples comparable before epitope calling. Common approaches include sequencing depth scaling, input library correction, total count normalization, and background subtraction using no-serum or bead-only controls. The best method depends on library design, sample number, control availability, and whether the study compares groups or maps epitopes within one antibody sample.
Background filtering is equally important for epitope identification. Some peptide clones bind capture reagents, beads, or phage components nonspecifically. Others recur in negative controls across many samples. These peptides should be flagged or removed before epitope regions are assigned.
|
Analysis Goal |
Common Processing Step |
Interpretation Value |
|---|---|---|
|
Depth correction |
Library size scaling |
Reduces sequencing depth bias |
|
Input correction |
Compare IP counts to input library |
Separates enrichment from clone imbalance |
|
Background removal |
Filter peptides enriched in negative controls |
Reduces false epitope calls |
|
Replicate review |
Compare technical replicate patterns |
Identifies unstable peptide signals |
|
Group comparison |
Model case-control or time-point contrasts |
Links enrichment to biological context |
Normalization cannot rescue failed experimental controls. If negative controls are missing or replicates disagree strongly, the project should return to QC review before epitope ranking proceeds.
Step 4: Identify Enriched Peptides and Tiled Epitope Regions
Epitope identification begins by finding peptides enriched above input and background thresholds. Enrichment can be expressed as fold change, log enrichment, normalized score, or model-based effect size depending on the analysis pipeline.
For linear epitope mapping, tiled libraries provide additional interpretive power. When neighboring peptides across a protein sequence show coordinated enrichment, the combined pattern supports a localized epitope interval more strongly than a single isolated peptide hit. Epitope calling should therefore consider both peptide-level ranking and regional continuity.
Strong epitope candidates often share these features:
- enrichment above input library and negative control backgrounds
- consistent signal across technical replicates
- stable enrichment within the relevant biological group
- support from adjacent tiled peptides when the library design allows regional mapping
- plausible annotation to the antigen or protein under study
Single-peptide spikes should be interpreted cautiously. They may represent real but narrow recognition events, or they may reflect sample-specific noise, clone bias, or mapping artifacts.
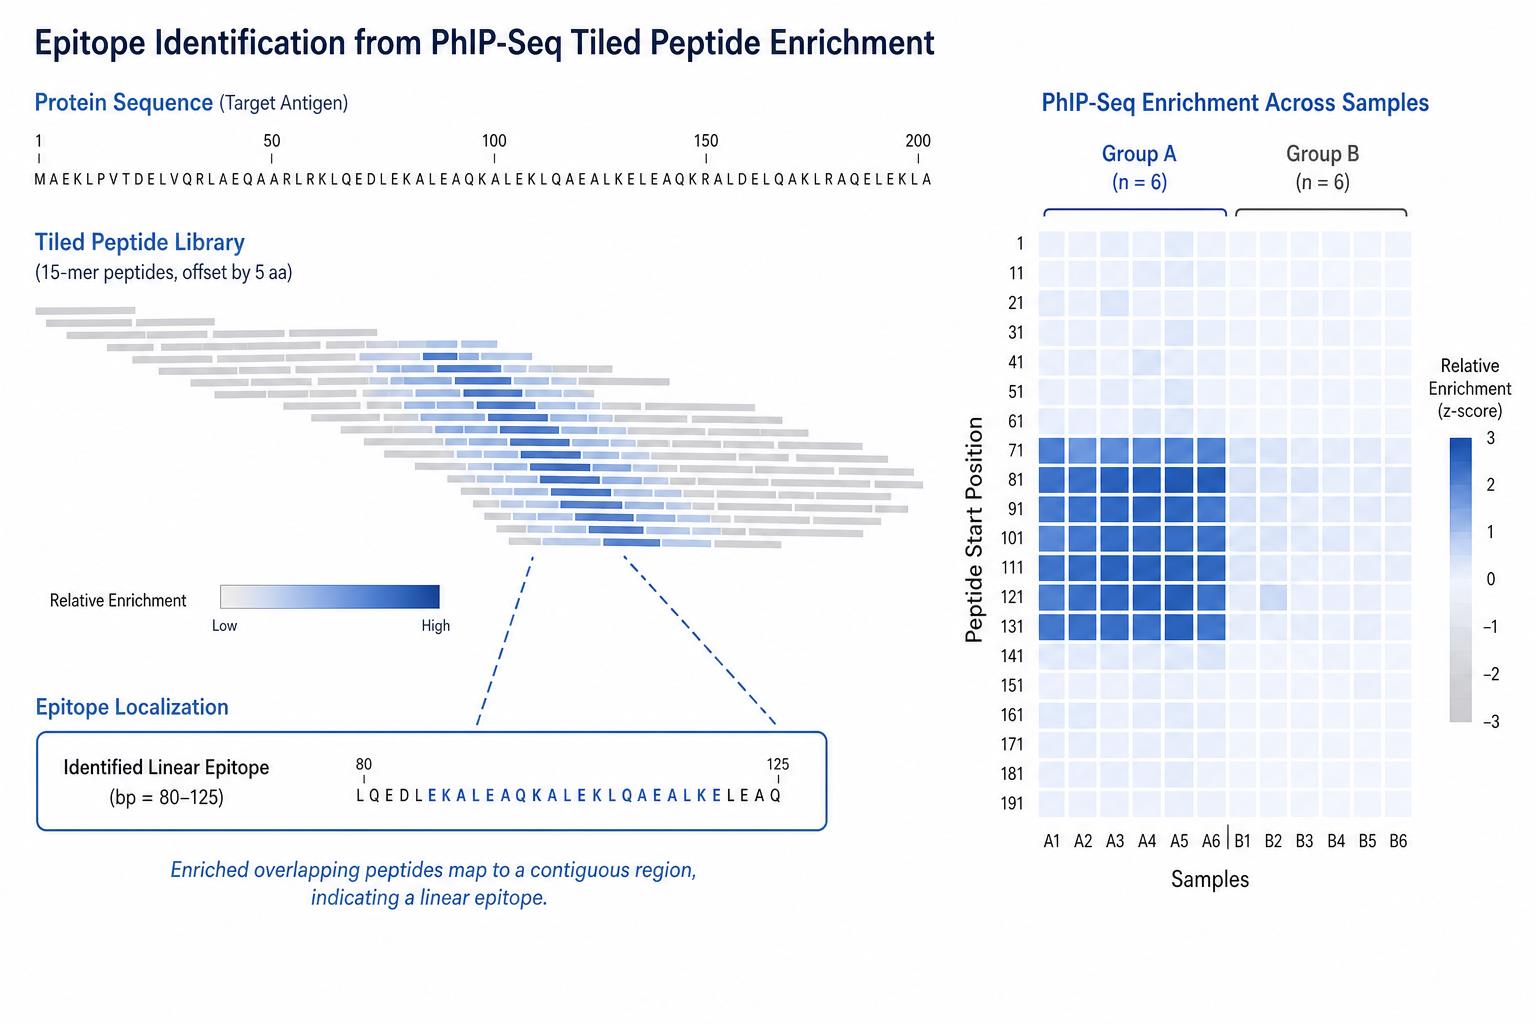
Figure 2. Adjacent enriched tiled peptides support linear epitope region assignment more strongly than isolated single-peptide enrichment signals.
Step 5: Prioritize Epitope Candidates for Validation
After enrichment and tiled-region review, candidates should be ranked for validation rather than reported as confirmed epitopes. Ranking should combine enrichment strength, replicate consistency, background level, regional support, annotation quality, and feasibility of follow-up assays.
A practical epitope shortlist should record, for each candidate:
- enrichment score and group contrast metrics
- input and negative control read support
- replicate concordance notes
- source protein or antigen annotation
- tiled-region boundaries when applicable
- recommended validation assay type
When a project produces many enriched peptides and the validation budget is limited, MtoZ Biolabs can help prioritize candidates based on control structure, library design, and the intended downstream use of the epitope data.
Typical Data Outputs for Epitope Identification
A report intended to support epitope identification should present both QC context and biological ranking. A peptide list alone is usually insufficient for validation planning or publication support.
|
Output Type |
Main Content |
Common Use |
|---|---|---|
|
QC summary |
Mapping rate, read depth, peptide coverage, replicate agreement |
Judge whether data support epitope calling |
|
Enrichment table |
Peptide scores, fold enrichment, annotations |
Rank candidate epitope peptides |
|
Heatmap |
Sample and group enrichment patterns |
Review group-specific epitope signals |
|
Volcano plot |
Effect size and significance for enriched peptides |
Balance stringency and discovery |
|
Tiled coverage track |
Enrichment across overlapping peptide regions |
Localize linear epitope intervals |
|
Validation shortlist |
Priority candidates with recommended assays |
Plan peptide array or ELISA follow-up |
Visual outputs should support interpretation. Heatmaps help review group clustering. Volcano plots help balance effect size and significance. Tiled coverage tracks are especially useful when the goal is regional epitope assignment rather than single-peptide discovery alone.
QC Warning Signs Before Epitope Calling
Several technical patterns should trigger caution before epitope regions are assigned.
- low mapping rate across many samples, suggesting reference mismatch or sequencing failure
- extreme input library imbalance dominated by a few clones
- broad enrichment in negative controls, suggesting bead or reagent background
- poor agreement between technical replicates
- candidate peptides driven by one outlier sample only
- group differences aligned with batch rather than biology
These issues should be documented in the analysis report. Proceeding to epitope validation without resolving major QC problems often wastes downstream assay effort.
From Epitope Candidates to Validation Assays
PhIP-Seq epitope identification produces candidate regions, not finalized epitope proof. Validation design should match candidate type and project goal.
Peptide arrays are useful for retesting selected regions across larger sample sets. ELISA or targeted immunoassays support confirmation of individual peptides. Protein-level binding assays help when recognition may depend on antigen context beyond the displayed peptide alone. Alanine scanning or substitution mapping can refine key residues once a region is confirmed.
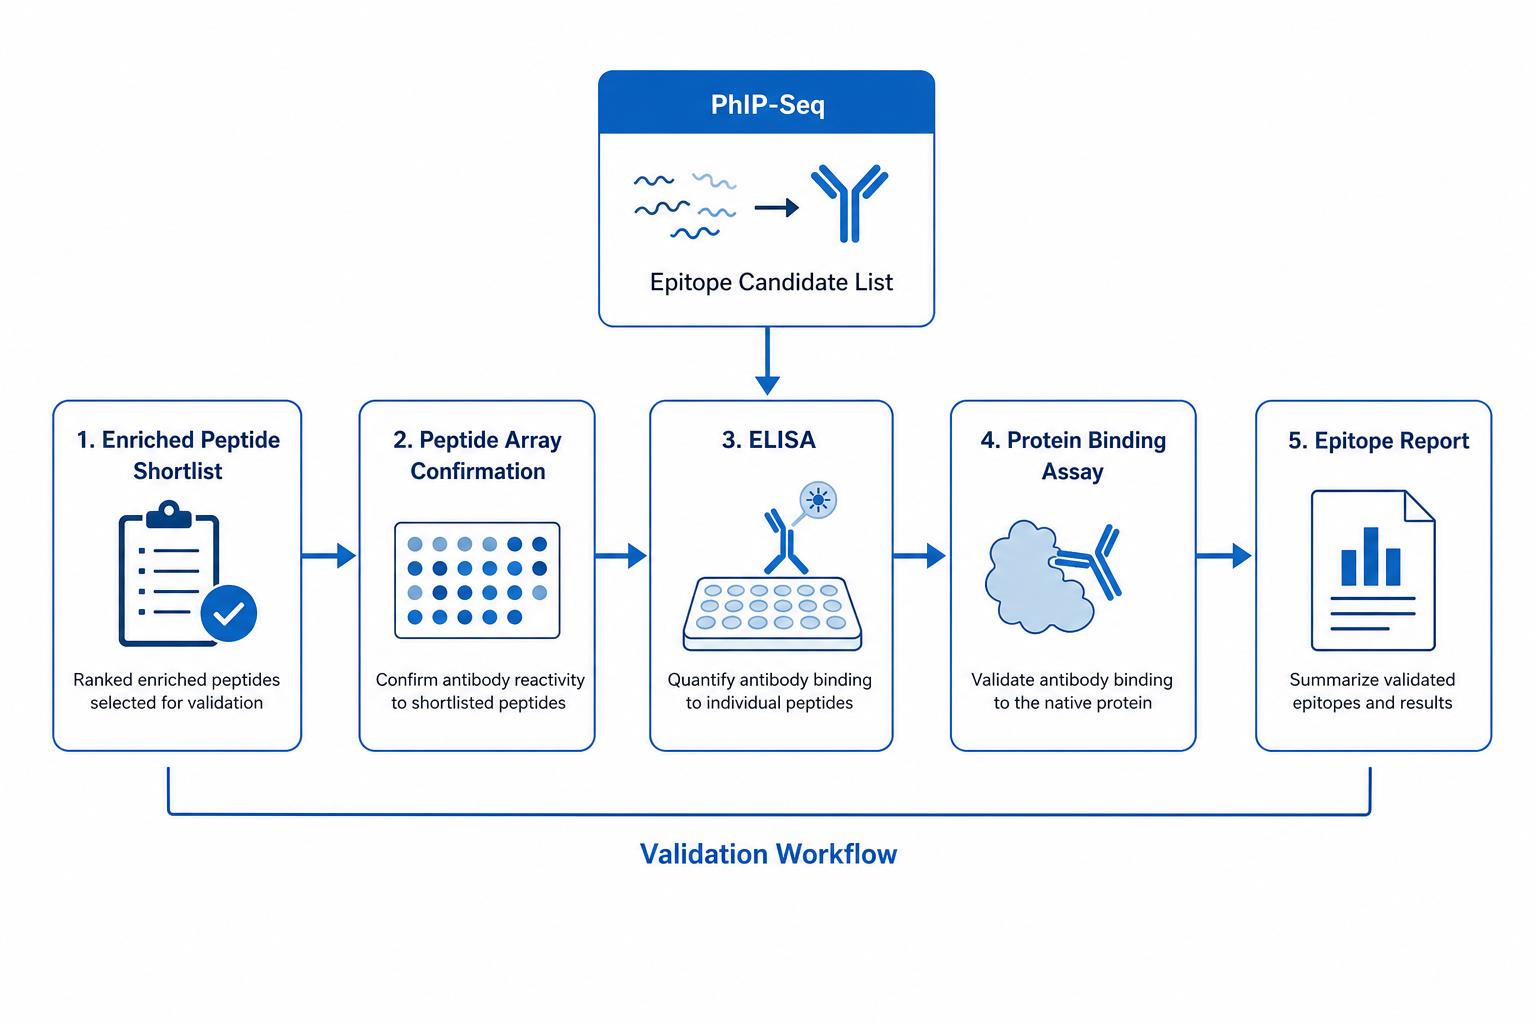
Figure 3. Epitope candidates from PhIP-Seq raw data analysis should be confirmed by peptide array, ELISA, or protein-level binding assays before final epitope assignment.
MtoZ Biolabs can connect PhIP-Seq epitope analysis with peptide array-based epitope mapping and antibody epitope mapping services to build a continuous discovery-to-validation workflow.
Frequently Asked Questions
1. What is the first step in epitope identification from PhIP-Seq raw data?
The first step is to quality-control sequencing reads and map them accurately to the peptide library reference used in the experiment. Accurate mapping is required before count normalization and epitope ranking.
2. Why is input library data necessary for epitope calling?
Input library data show starting clone abundance before immunoprecipitation. Comparing sample counts with input helps distinguish antibody-driven enrichment from library imbalance.
3. Does a high read count mean an epitope has been identified?
No. High read counts must be evaluated against input libraries, negative controls, replicate consistency, and tiled-region support before a peptide is treated as an epitope candidate.
4. How are linear epitopes localized from PhIP-Seq data?
When a tiled library is used, adjacent enriched peptides across a protein sequence can be grouped into a candidate linear epitope interval with stronger support than isolated single-peptide hits.
5. How should PhIP-Seq epitope candidates be validated?
Common validation routes include peptide arrays, ELISA, targeted immunoassays, and protein-level binding experiments. The chosen method should match the candidate type and project goal.
Conclusion
Epitope identification from PhIP-Seq raw data depends on a structured analysis path that converts sequencing counts into interpretable peptide and region-level candidates. Read QC, library mapping, count matrix construction, normalization, background filtering, enrichment analysis, and tiled-region review are all required before epitope shortlists are sent to validation.
Raw enrichment alone does not define an epitope. Reliable epitope identification requires control-aware analysis, replicate review, and orthogonal confirmation matched to the intended use of the results. Researchers working with PhIP-Seq raw data can contact MtoZ Biolabs to review analysis quality, prioritize epitope candidates, and plan the validation workflow best suited to the project before downstream assays begin.
How to order?




