



Protein–protein interaction (PPI) network visualization is the drawing of a graph so that a scored or curated interaction table can be inspected. Nodes are proteins. Edges are reported contacts. The picture can make hubs, modules, and layout patterns easier to see. It does not create those contacts, and it does not raise the confidence of an unlabeled STRING score or an unscored AP-MS prey. Visualization is therefore a reading step after an experimental table, a curated download, or a clearly marked predicted overlay exists.
PPI networks are used to place proteins in signaling or disease neighborhoods and to decide which nodes deserve a follow-up assay. Tumor examples in which an unusual module is discussed still inherit the evidence on each edge. A striking layout is not a discovery until the source of those edges is stated.
Researchers who already have a scored partner table, a curated edge list, or a project objective can also review the MtoZ Biolabs Protein-Protein Interaction Analysis Service for project-specific feasibility and analysis planning.
What Protein–Protein Interaction Visualization Is
Visualization represents physical or functional associations as maps. The useful unit is not the image file. It is an edge with a source: a Y2H or AP-MS table from the current study, a BioGRID or IntAct record, or a predicted channel that must stay on a separate layer.
Biological uses that a drawing can support
A labeled network can help rank candidate regulatory nodes, display modules after a clustering rule is stated, compare a tissue- or disease-restricted subgraph, and overlay quantitative proteomics or enrichment results. Those uses are interpretation. They are not target identification and they are not a prognostic assay. For how experimental, predicted, and database edges should be kept apart when the graph is first built, Protein-Protein Interaction Mapping Methods and Applications provides a more detailed discussion of mapping layers.
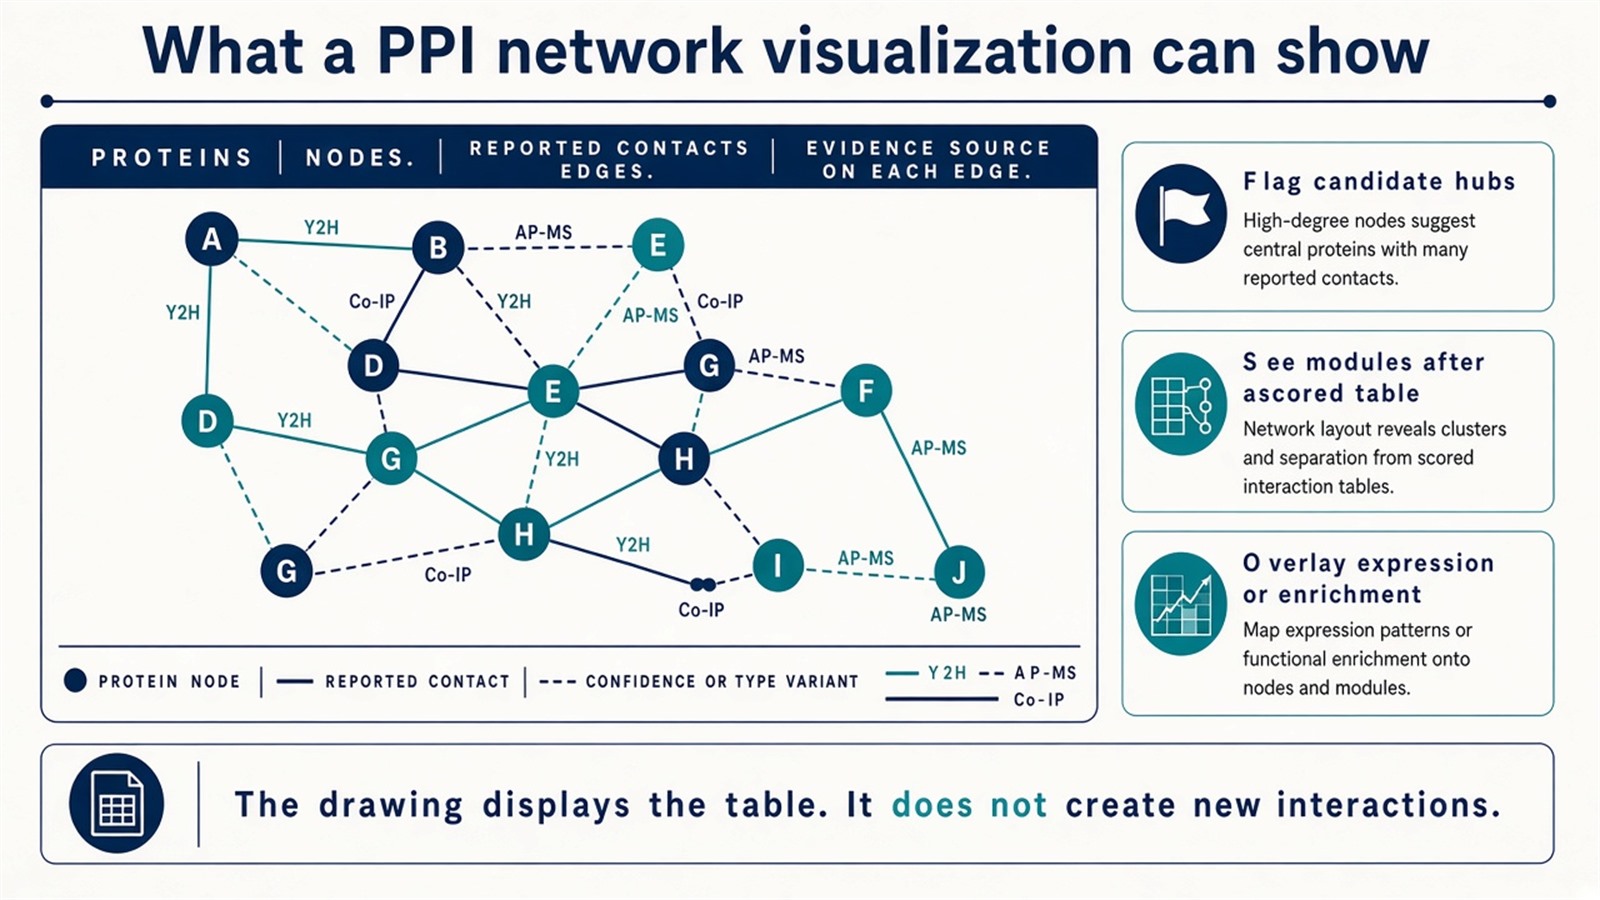
Figure 1. A PPI visualization displays nodes, edges, and the source of each edge. The drawing does not add interactions that were not in the table.
The figure is a view of the table. Layout quality is not evidence quality.
Commonly Used PPI Visualization Databases and Tools
1. STRING
STRING is an integrated association database with a built-in interactive viewer and multi-species coverage. Users can enter gene or protein names and retrieve a neighborhood that mixes experimental records, text mining, co-expression, and predicted channels. Pathway and function panels are available in the same session, and networks can be exported to Cytoscape.
Those channels must remain visible. A combined score driven by text mining is not equivalent to an experimental edge in the current lysate. STRING is the usual first look at a public neighborhood. It is not validation of an AP-MS table.
2. Cytoscape
Cytoscape is an open-source network platform and the usual home for a user-defined PPI map. Large graphs can be laid out, filtered, and annotated. Plugins commonly used on PPI tables include ClueGO for pathway enrichment, MCODE for module detection, and cytoHubba for hub ranking. Quantitative proteomics or differential-abundance columns can be imported as node attributes.
Cytoscape fits projects that already have a scored edge table and need custom views. Plugin output is a ranking or a cluster, not independent proof that a hub is a drug target.
3. NAViGaTOR (Network Analysis, Visualization, and Graphing, Toronto)
NAViGaTOR is built for large-graph rendering and can display networks in 2D or 3D, with filtering and attribute annotation. It is useful when a very large public or merged graph must be inspected or shown. It also asks for more graphics capacity than a browser STRING session. Lightweight neighborhood checks do not need it.
4. Gephi
Gephi is a general graph tool, not a biology workbench. It is used on PPI tables when the next sentence is topological: degree, clustering coefficient, or a publication layout. It does not ship ClueGO- or MCODE-class biology plugins. Degree in Gephi is still only degree of the imported graph.
5. BioGRID, IntAct, HPRD, and related edge sources
These resources supply interaction records more often than they draw advanced figures. BioGRID and IntAct provide curated literature and consortium edges. HPRD is an older, human-focused literature compilation and is no longer a primary updating source. Edges from any of them should be imported into Cytoscape or a similar platform and kept labeled as prior knowledge. They do not confirm the sample in hand.
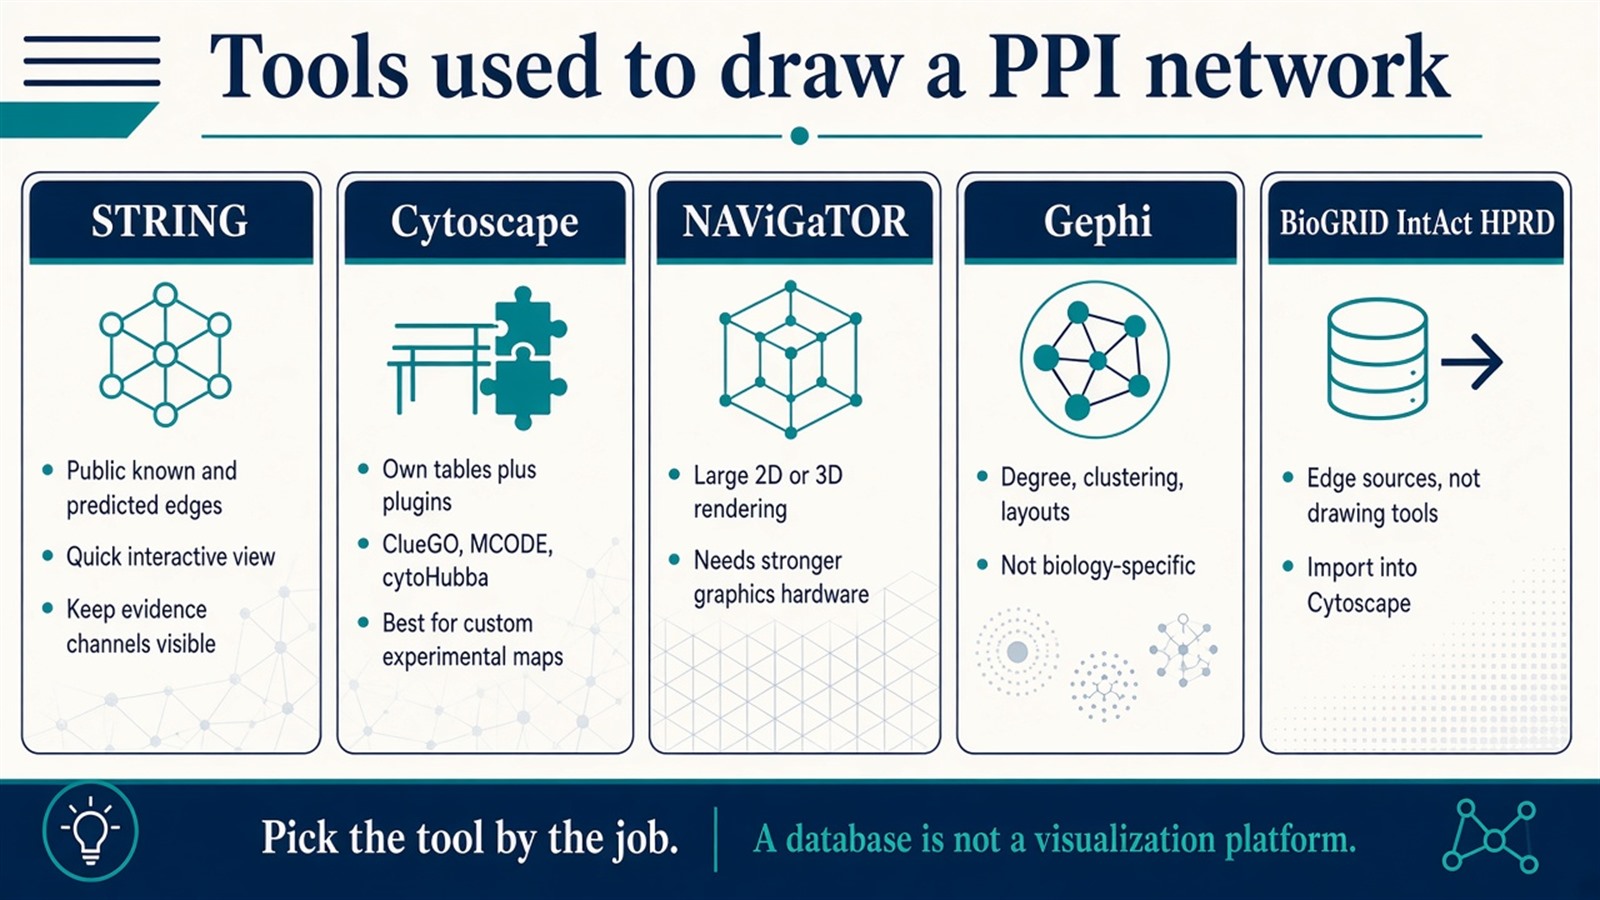
Figure 2. STRING gives a public view, Cytoscape builds from a user table, NAViGaTOR renders large 2D or 3D graphs, Gephi computes topology, and BioGRID or IntAct supply edges rather than drawings.
How to Select an Appropriate PPI Visualization Tool
The empty choice on many project pages is which software to open first. The decision follows the job, not a generic ranking of platforms.
Visualization job |
Tool that often fits |
Reassess when |
|---|---|---|
Browse a public known or predicted neighborhood |
STRING |
The claim is the current experimental table |
Build a map from a scored user table and omics attributes |
Cytoscape |
Only a quick public neighborhood is needed |
Render a very large graph in 2D or 3D |
NAViGaTOR |
The session is a small browser view |
Compute topology or polish a figure |
Gephi |
Biology-specific enrichment plugins are required |
Fetch curated literature or consortium edges |
BioGRID, IntAct |
A drawing platform is still needed after the download |
Hardware, plugin familiarity, and figure style are constraints. They do not decide whether an edge is experimental, predicted, or imported. For how predicted overlays should stay separate from measured edges, Experimental vs Computational Methods for Protein Interaction Detection provides a more detailed comparison of allowed claims.
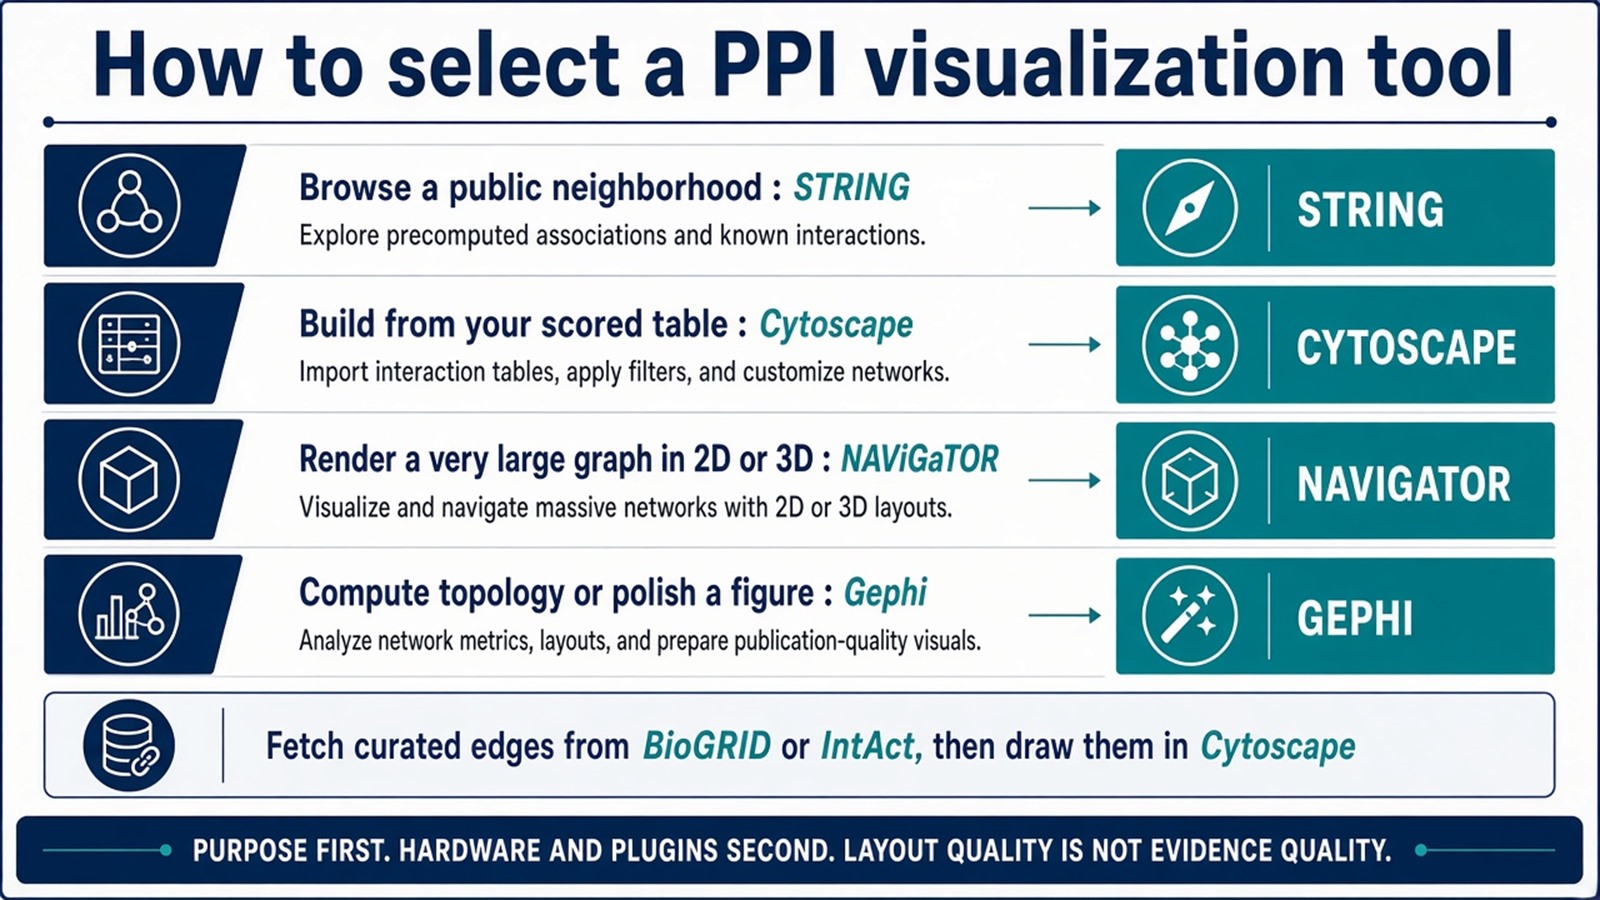
Figure 3. Purpose selects the first tool; curated databases feed edges into Cytoscape. Layout quality does not upgrade evidence.
From Visualization to Biological Interpretation
Visualization is the first inspection. Interpretation still needs a written rule for what an edge means.
A common path is to take differentially abundant proteins, attach only edges that have a stated source, detect modules, then run enrichment on those modules. Hub ranking can order proteins for Co-IP or a second capture chemistry. Clinical variables can be stored as attributes on the same graph. That overlay does not construct a prognosis-associated assay and does not identify a therapeutic target.
When the starting material is still an unfiltered enrichment list, How to Identify Protein–Protein Interactions Using Mass Spectrometry provides a more detailed explanation of how the experimental table should be closed before it is drawn.
Experimental Limits and Design Boundaries
STRING will mix evidence channels unless the user keeps them visible. Cytoscape will draw contaminants if they remain in the import. Gephi will compute high degree on a hub that is only a frequent prey. NAViGaTOR will render a large graph that is still only as strong as its edges. Disease-module and multi-omics language remains interpretive. Diagnostic or companion-diagnostic claims sit outside ordinary research visualization unless a separately validated assay framework is in place.
Project Planning and Service Scope
A usable visualization plan names the edge source, the tool, the attributes to overlay, and which nodes will be sent back to a wet-lab check. MtoZ Biolabs scopes AP-MS or Co-IP-MS tables on Orbitrap-class LC-MS/MS, control-aware partner lists, and subsequent network annotation and figure preparation after that table is closed. A drawing cannot recover a partner that enrichment and filtering did not retain.
Once the edge source, visualization tool, and follow-up nodes are defined, the project can be scoped as a PPI network-analysis study. Researchers can review the MtoZ Biolabs Protein-Protein Interaction Analysis Service for project-specific sample evaluation, feasibility assessment, and workflow planning.
Frequently Asked Questions
1. Does PPI network visualization prove that two proteins interact?
No. The figure displays edges that were imported. Proof stays with the assay or the curated record that produced each edge.
2. When should STRING be used instead of Cytoscape?
STRING fits a first look at a public neighborhood. Cytoscape fits a user table that must carry experimental scores, abundance, or custom modules.
3. Is Gephi better than Cytoscape for PPI work?
Not as a biology platform. Gephi fits topology and figure layout. Cytoscape fits plugin-based enrichment and module work on experimental maps.
4. Can a project skip experimental data and visualize only STRING?
It can browse prior knowledge. It cannot claim that those edges were recovered in the current samples.
5. Do hub-finding plugins identify drug targets?
No. cytoHubba and similar tools rank nodes on the imported graph. Target nomination still needs a defined contact and a matched assay.
Reference
- Shannon P., Markiel A., Ozier O., et al. (2003). Cytoscape: a software environment for integrated models of biomolecular interaction networks. Genome Res., 13, 2498-2504. https://doi.org/10.1101/gr.1239303
- Szklarczyk D., Gable A.L., Lyon D., et al. (2019). STRING v11: protein-protein association networks with increased coverage, supporting functional discovery in genome-wide experimental datasets. Nucleic Acids Res., 47, D607-D613. https://doi.org/10.1093/nar/gky1131
- Oughtred R., Rust J., Chang C., et al. (2021). The BioGRID database: a comprehensive biomedical resource of curated protein, genetic, and chemical interactions. Protein Sci., 30, 187-200. https://doi.org/10.1002/pro.3978
- Orchard S., Ammari M., Aranda B., et al. (2014). The MIntAct project—IntAct as a common curation platform for 11 molecular interaction databases. Nucleic Acids Res., 42, D358-D363. https://doi.org/10.1093/nar/gkt1115
- Bastian M., Heymann S., Jacomy M. (2009). Gephi: an open source software for exploring and manipulating networks. Proc. Int. AAAI Conf. Web Soc. Media, 3, 361-362. https://doi.org/10.1609/icwsm.v3i1.13937
- Brown K.R., Otasek D., Ali M., et al. (2009). NAViGaTOR: Network Analysis, Visualization and Graphing Toronto. Bioinformatics, 25, 3327-3329. https://doi.org/10.1093/bioinformatics/btp595
