



This tutorial shows how to turn a differential proteomics list into a Protein–Protein Interaction (PPI) network view with STRING and Cytoscape. Proteins act in signaling, regulatory, and metabolic assemblies, so a neighborhood map can help rank nodes and write the next mechanistic sentence. The map is an association graph: public experimental, predicted, text-mined, or co-evolutionary edges are placed among proteins that changed in the study. It does not measure those contacts in the current lysate, and it does not discover biomarkers or therapeutic targets by itself.
Use the steps below when the job is visualization and module inspection of a protein list. When the next sentence needs sample-level edges, add yeast two-hybrid (Y2H), co-immunoprecipitation, or affinity purification–mass spectrometry (AP-MS) as a separate layer.
Researchers who already have a differential protein table or a project objective can also review the MtoZ Biolabs Protein-Protein Interaction Analysis Service for project-specific feasibility and analysis planning.
What This Tutorial Produces
STRING retrieves a scored neighborhood. Cytoscape draws it, maps abundance onto nodes, and runs plugins. Reliability still follows the evidence channel on each edge, not the layout. For how visualization differs from measured network construction, How to Build and Analyze Protein-Protein Interaction Networks? provides a more detailed build-versus-overlay framework. For tool selection beyond STRING and Cytoscape, What Is Protein-Protein Interaction (PPI) Network Visualization? Recommended Tools and Software compares STRING, Cytoscape, NAViGaTOR, and Gephi.
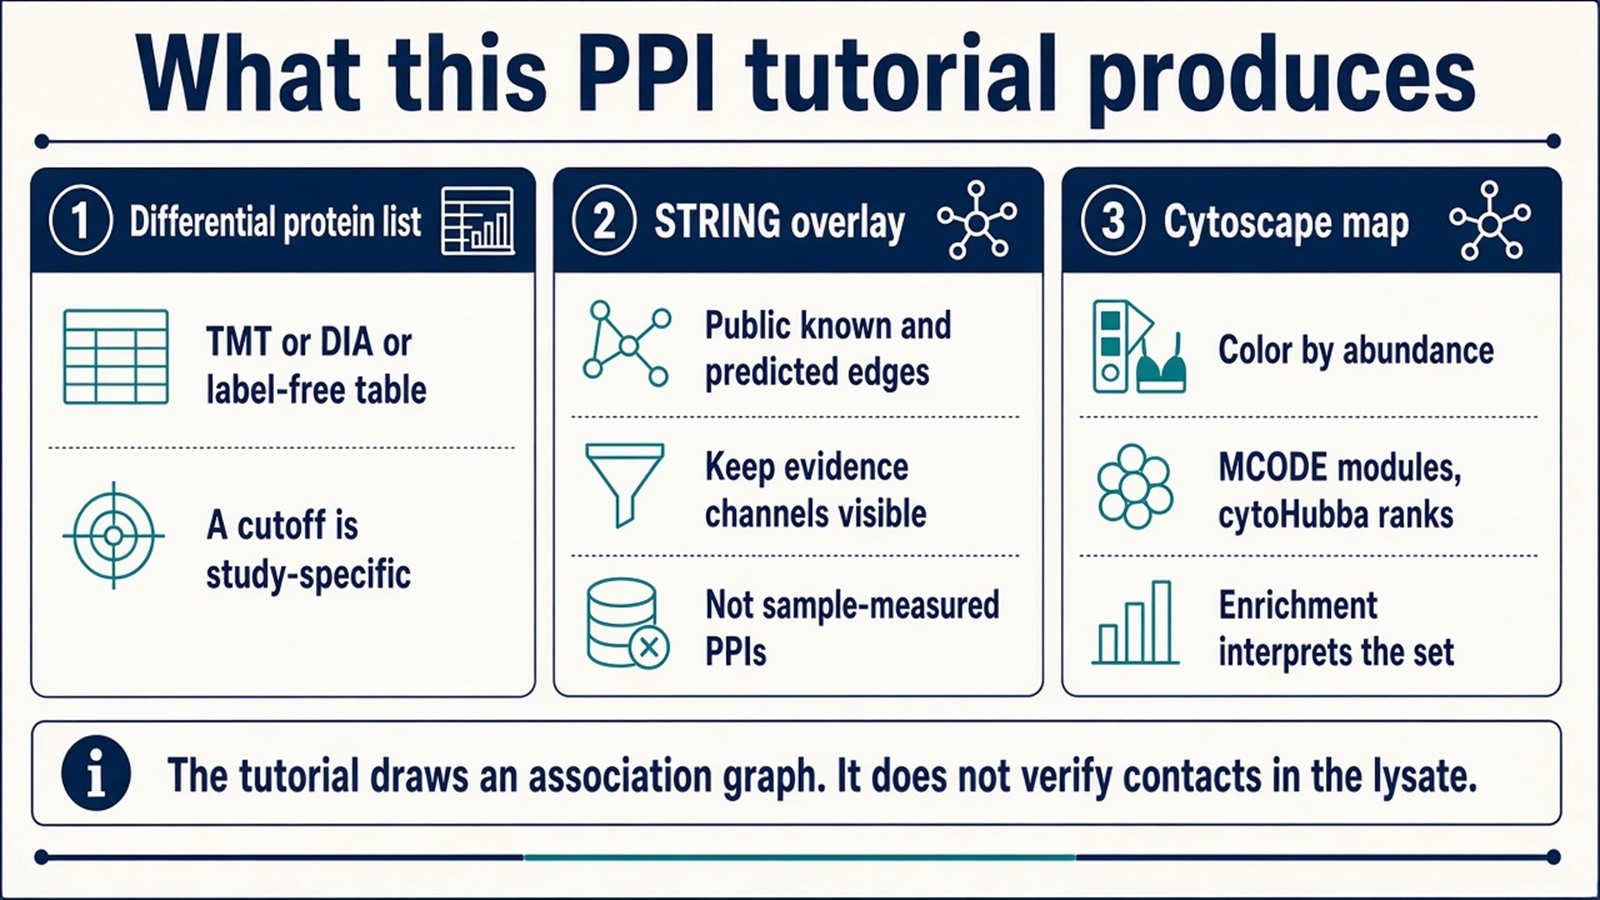
Figure 1. The tutorial overlays public STRING edges on a differential protein list and inspects the graph in Cytoscape. That drawing is not a verified interactome of the sample.
A tutorial output is a labeled association map. Plugin ranks do not convert it into experimental PPI evidence.
Common Protein Interaction Databases Used in the Tutorial
1. STRING
STRING (Search Tool for the Retrieval of Interacting Genes/Proteins) integrates experimental records, computational prediction, literature mining, and co-evolutionary signals. Coverage includes humans, mice, plants, and many other species. Each pair receives a combined score between 0 and 1. A built-in viewer and enrichment panel are available before export.
The combined score is not a high-confidence stamp unless the contributing channels are inspected. A text-mining-heavy edge among two differential proteins is not an AP-MS contact. STRING is nevertheless the usual first resource for drafting a neighborhood around mass-spectrometry protein lists.
2. BioGRID, IntAct, and DIP
BioGRID, IntAct, and the Database of Interacting Proteins (DIP) are richer in curated experimental literature, including Y2H, co-immunoprecipitation, and mass spectrometry records. They fit projects that want fewer predicted channels. They still report published experiments, not the current sample. Import those edges into Cytoscape and keep the source labeled.
Cytoscape and the Plugins This Tutorial Uses
Cytoscape is an open-source platform for biological network visualization. Node shape and color, edge weight, and abundance or annotation attributes can be mapped onto a user table. A large plugin catalog covers clustering, enrichment, and condition comparison. The empty “recommended plugins” block on many pages should be filled with the five apps actually used below.
STRINGapp imports STRING edges, scores, and species settings without a manual file round-trip.
MCODE finds dense modules. Those clusters are follow-up units, not proven complexes.
cytoHubba ranks degree, betweenness, or closeness on the imported graph. The rank is graph-specific.
ClueGO runs Gene Ontology (GO) or KEGG-style enrichment on a selected node set. Enrichment interprets the set. It does not validate edges.
dyNet compares networks across time points or treatments when each graph was built from a stated edge source.
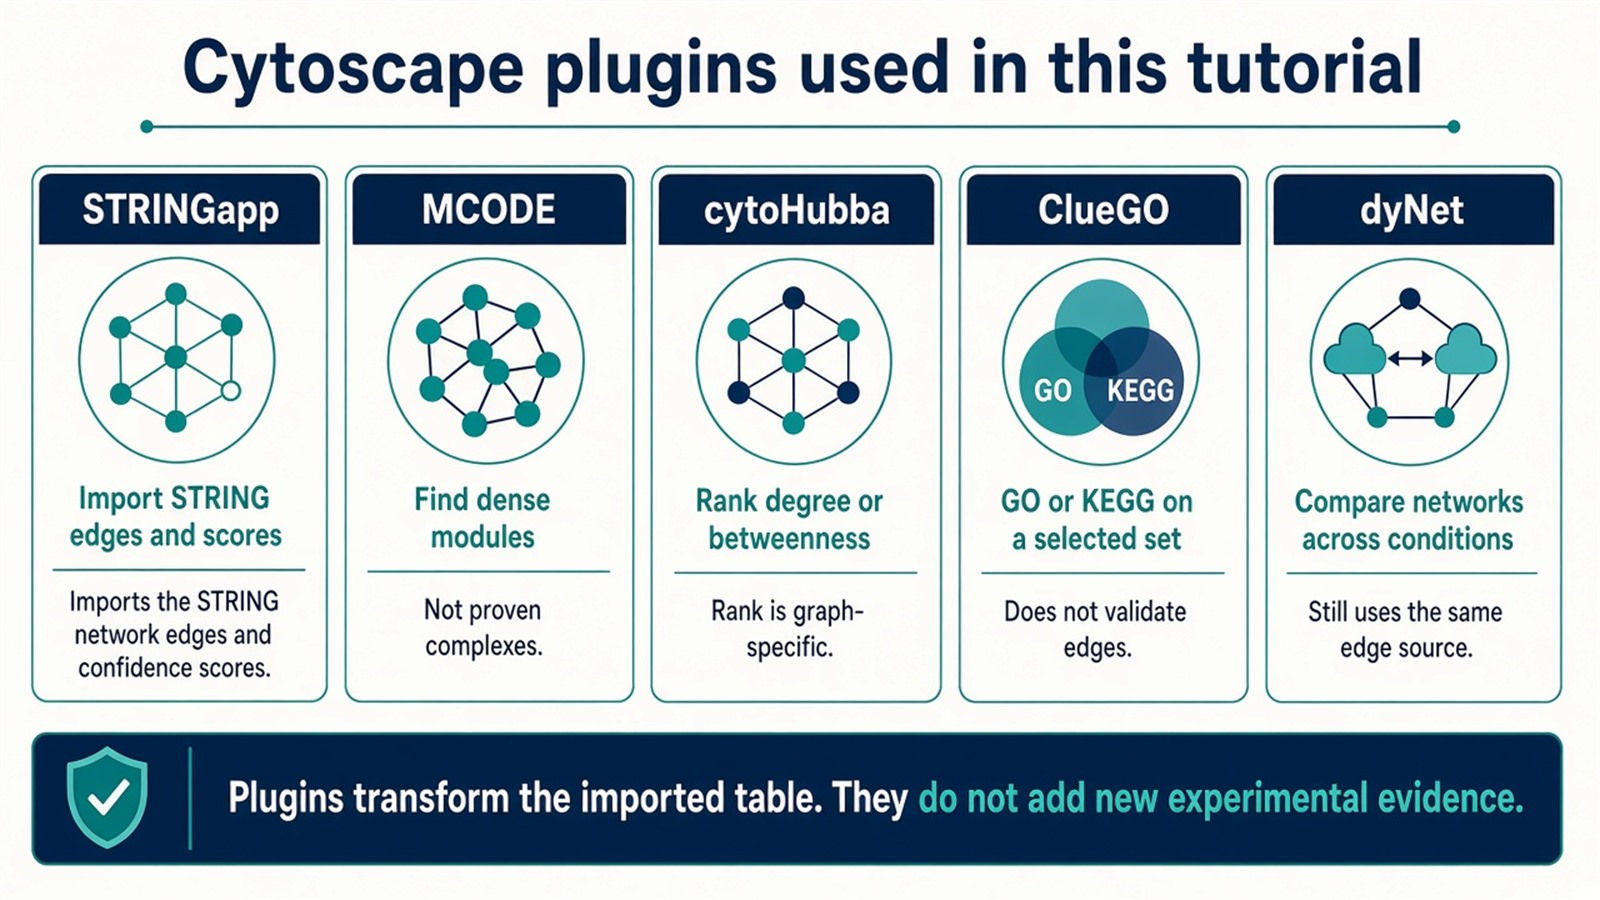
Figure 2. Plugins import, cluster, rank, enrich, or compare the current graph. They do not add new experimental interactions.
Practical Workflow: STRING plus Cytoscape
1. Prepare the differential protein list
Start from a quantitative proteomics table (label-free, TMT, or DIA). Define a study-specific cutoff. Log2 fold change greater than 1 and p less than 0.05 is one common example, not a universal rule. Convert identifiers to UniProt accessions or official gene symbols and record the species.
2. Draft the network in STRING
Open STRING, enter the protein list, and select the matching species. Set a score floor to keep the graph readable. A combined score of 0.7 is a starting filter, not a reliability proof. Open the evidence channels and drop or flag text-mining-only edges if the next sentence needs experimental support. Export TSV or XGMML, or skip the file and use STRINGapp in the next step.
3. Visualize and cluster in Cytoscape
Launch Cytoscape and install STRINGapp. Import the file or retrieve the same list through the app. Map abundance to node color or size. Run MCODE for modules and cytoHubba only after the edge source is acceptable. Do not treat the first layout as the result.
4. Interpret with enrichment
Run ClueGO, or export the module to DAVID or Metascape. Record enriched KEGG pathways and GO processes as hypotheses about that protein set. Mapping enrichment colors onto the network helps reading. It does not make the STRING edges sample-true.
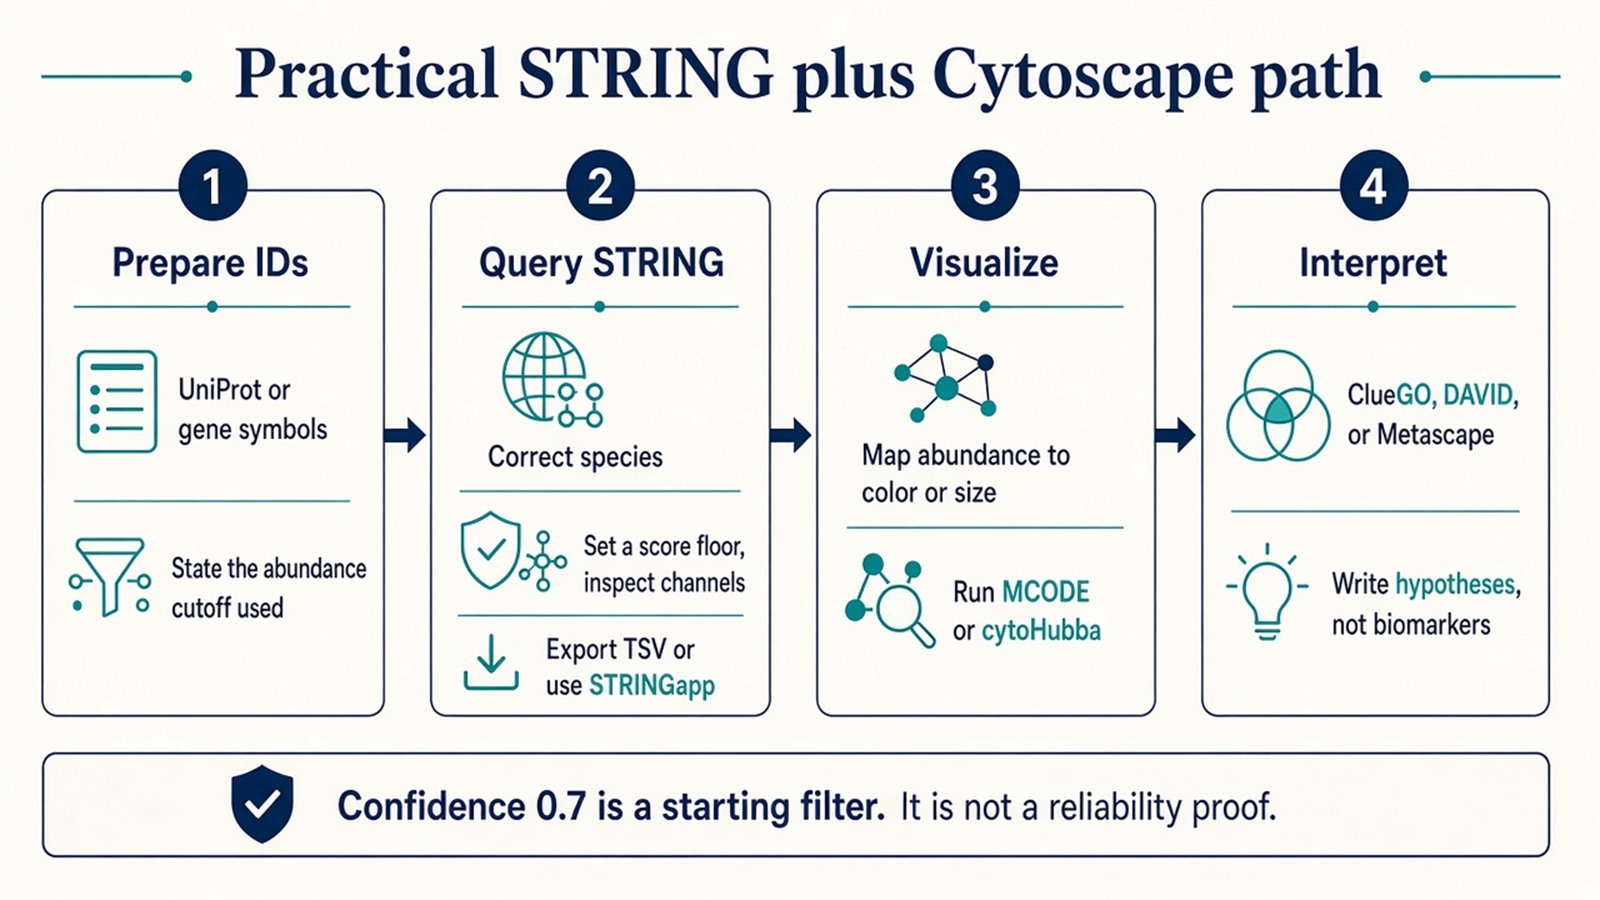
Figure 3. Prepare IDs, query STRING with visible evidence channels, visualize and cluster in Cytoscape, then enrich the selected set.
Advanced Options: Condition Comparison and Extra Attributes
Static STRING maps do not show time. For multi-condition or time-series tables, dyNet can highlight nodes or edges that change between graphs. Transcript or phosphopeptide attributes can be added as extra columns. Those overlays enrich the picture. They still sit on the same public or imported edges unless an experimental PPI assay is added.
Common Problems in This Tutorial Path
1. The network is too large to read
Raise the STRING score floor, tighten the abundance cutoff, or extract MCODE modules. Haircut the graph before adding more omics layers.
2. How to judge an edge in STRING
Read the channel annotation, not only the combined score. Prefer edges marked experimental when the claim is mechanistic. Literature support is prior knowledge. It is not a replicate of the current mass spectrometry experiment.
3. How to rank nodes
Degree, betweenness, and closeness in cytoHubba order proteins on this graph. High rank is a shortlist for Western or IP follow-up. It is not key-node proof.
Experimental Limits and Design Boundaries
STRING will mix prediction and text mining unless channels stay visible. Cytoscape will draw contaminants that remain in the differential list. A 0.7 score cutoff is arbitrary relative to biology. SCI-style figures and AI language do not raise evidence class. Diagnostic, biomarker, or precision-medicine claims sit outside ordinary tutorial reporting unless a separately validated assay framework is in place.
Project Planning and Service Scope
A usable tutorial plan names the abundance cutoff, the STRING species and score floor, the plugins that will be run, and which modules return to a wet-lab check. MtoZ Biolabs scopes Orbitrap-class or timsTOF quantification when a differential table is required, then STRING-to-Cytoscape annotation after that table is closed. The drawing cannot recover a contact that was never measured.
Once the list, score floor, and follow-up modules are defined, the project can be scoped as a PPI network-analysis study. Researchers can review the MtoZ Biolabs Protein-Protein Interaction Analysis Service for project-specific sample evaluation, feasibility assessment, and workflow planning.
Frequently Asked Questions
1. Does following this STRING plus Cytoscape tutorial verify PPIs in my sample?
No. It places public associations among your proteins. Sample-level verification still needs Co-IP, Y2H, or AP-MS.
2. Should every study use Log2FC > 1 and p < 0.05?
No. That pair is one example. The cutoff belongs to the experimental design and the multiple-testing rule used in the proteomics table.
3. Is a STRING score of 0.7 enough to call an edge reliable?
No. It is a starting filter. Open the evidence channels before writing a mechanistic sentence.
4. Which Cytoscape plugin should be installed first?
STRINGapp if the edges come from STRING. Add MCODE, cytoHubba, and ClueGO only after the import is clean.
5. Can cytoHubba identify therapeutic targets?
No. It ranks nodes on the current graph. Target nomination still needs a defined contact and a matched assay.
Reference
- Shannon P., Markiel A., Ozier O., et al. (2003). Cytoscape: a software environment for integrated models of biomolecular interaction networks. Genome Res., 13, 2498-2504. https://doi.org/10.1101/gr.1239303
- Szklarczyk D., Gable A.L., Lyon D., et al. (2019). STRING v11: protein-protein association networks with increased coverage, supporting functional discovery in genome-wide experimental datasets. Nucleic Acids Res., 47, D607-D613. https://doi.org/10.1093/nar/gky1131
- Bader G.D., Hogue C.W. (2003). An automated method for finding molecular complexes in large protein interaction networks. BMC Bioinformatics, 4, 2. https://doi.org/10.1186/1471-2105-4-2
- Bindea G., Mlecnik B., Hackl H., et al. (2009). ClueGO: a Cytoscape plug-in to decipher functionally grouped gene ontology and pathway annotation networks. Bioinformatics, 25, 1091-1093. https://doi.org/10.1093/bioinformatics/btp101
- Chin C.H., Chen S.H., Wu H.H., et al. (2014). cytoHubba: identifying hub objects and sub-networks from complex interactome. BMC Syst. Biol., 8, S11. https://doi.org/10.1186/1752-0509-8-S4-S11
- Doncheva N.T., Morris J.H., Gorodkin J., Jensen L.J. (2019). Cytoscape StringApp: network analysis and visualization of proteomics data. J. Proteome Res., 18, 623-632. https://doi.org/10.1021/acs.jproteome.8b00702
