



Protein–protein interaction (PPI) network analysis is a strategy problem before it is a software problem. Proteins coordinate signal transduction, metabolic regulation, cell-cycle control, and immune responses as assemblies. A protein–protein interaction network (PPIN) is a graph: nodes are proteins, edges are reported contacts. The useful first decision is which edge type will be drawn—physical binding or functional association—and whether those edges will be measured or predicted. Topology, modules, and disease language then inherit that choice. They do not create a foundation for precision medicine by themselves.
A strategy therefore has two stages. First, acquire edges with a stated method. Second, analyze only what that method is allowed to support. Mixing yeast two-hybrid (Y2H) binaries, an affinity purification–mass spectrometry (AP-MS) neighborhood, and an AlphaFold-Multimer pose into one unlabeled graph is the usual source of over-read hubs.
Researchers who already have a bait, a predicted shortlist, or a project objective can also review the MtoZ Biolabs Protein-Protein Interaction Analysis Service for project-specific feasibility and analysis planning.
What a PPI Network Is Allowed to Show
A PPIN can display which proteins were recovered together, which pairs were reported in a screen, and which predicted or curated associations sit nearby. It can help rank candidate regulators and modules. It cannot, by itself, predict a pathogenic mechanism.
Direct binding means physical contact or a complex under a stated assay. Functional association means coordinated activity through regulation or modification, without requiring that the two proteins touch. Those two edge classes must stay labeled. Construction is data acquisition plus annotation and visualization, not a single comprehensive analysis.
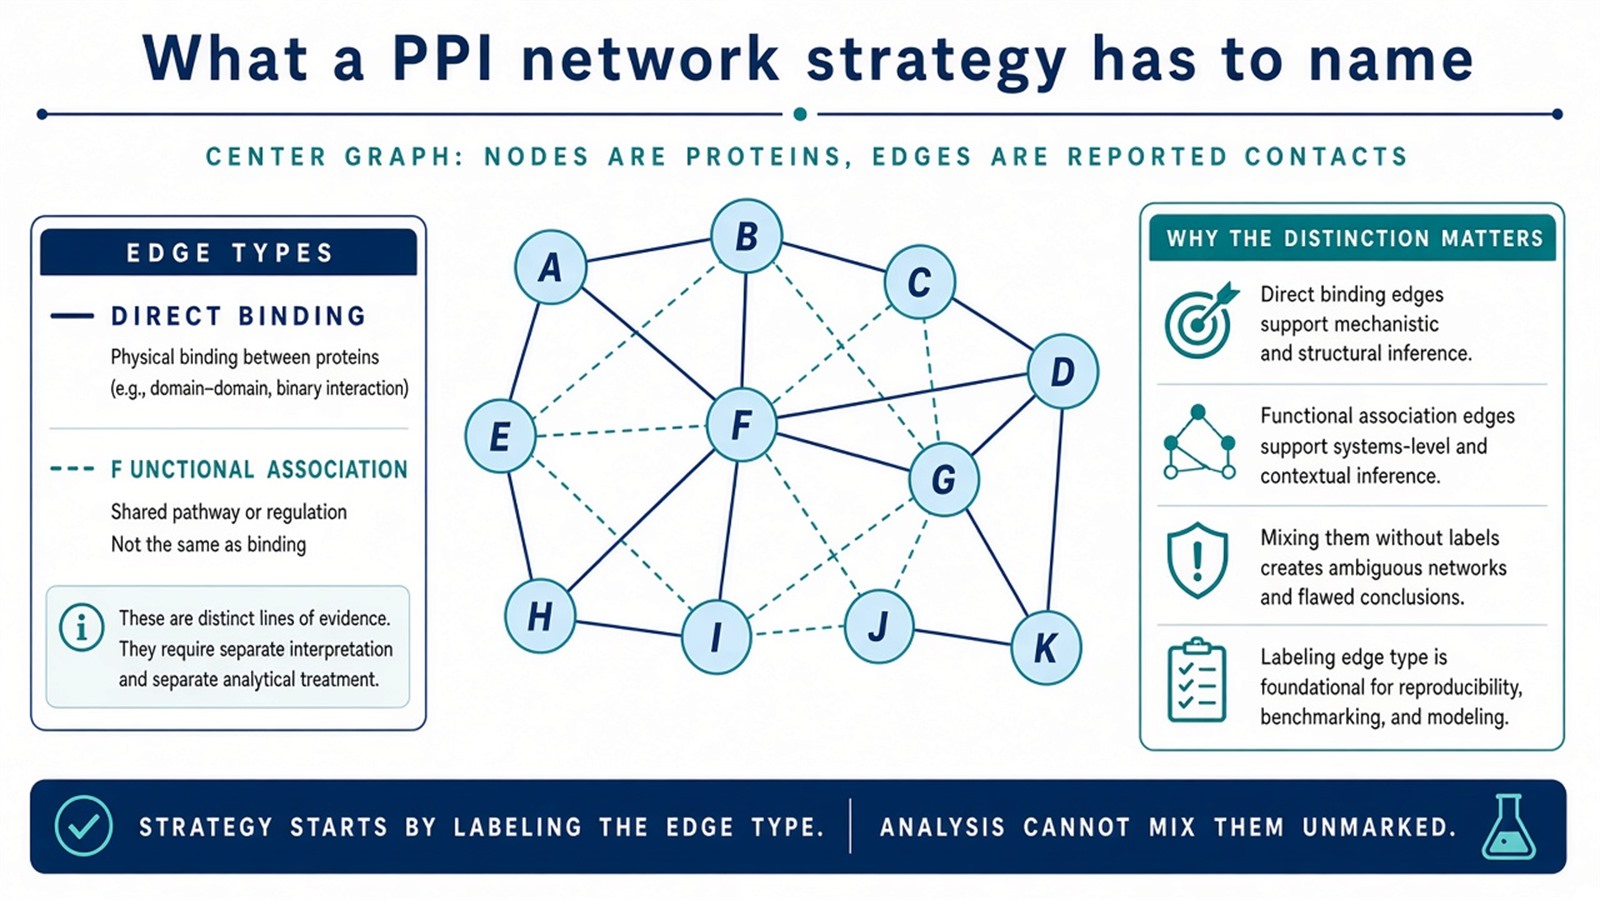
Figure 1. A PPIN is a labeled graph. Direct binding and functional association are different edge types and cannot be merged unmarked.
Strategy starts by naming the edge. Analysis cannot repair an unlabeled mix.
Acquiring Edges: Experimental and Computational Strategies
1. Experimental methods
Y2H fuses two proteins to a DNA-binding domain and a transcriptional activation domain. Interaction in yeast reconstitutes reporter expression. Throughput is high and the assay reports a binary genetic event. False positives are common, and membrane proteins or large complexes are often missed. Binary in yeast is not the same as direct binding in the original cell.
Co-immunoprecipitation (Co-IP) uses an antibody to enrich a target and proteins that survive wash, then Western or mass spectrometry. It fits stable, wash-persistent contacts under near-physiological lysis when the antibody is IP-grade. Transient or weak pairs are often lost.
AP-MS tags a bait, purifies it, and identifies co-purified proteins. It is widely used for complex composition and condition comparison. Tagged AP-MS is not an endogenous untagged assay. Empty-tag controls belong in the set. For evidence-type limits, How to Identify Protein–Protein Interactions Using Mass Spectrometry provides a more detailed explanation.
Crosslinking mass spectrometry (XL-MS) stabilizes proximal residues and identifies crosslinked peptides. The useful product is a spatial constraint, not a complete structural characterization of the interface.
2. Computational prediction
Prediction expands pair space when exhaustive wet-lab coverage is impractical. Interolog mapping transfers conserved interactions across species. Domain–domain rules score pairs that carry known interacting domains. Machine-learning models combine sequence, expression, annotation, and Gene Ontology features. AlphaFold-Multimer can propose complex geometry.
These methods rank plausible edges. They do not advance accuracy to the level of a measured contact. For class-by-class prediction limits, What Is PPI Prediction? provides a more detailed account of what a score may report.
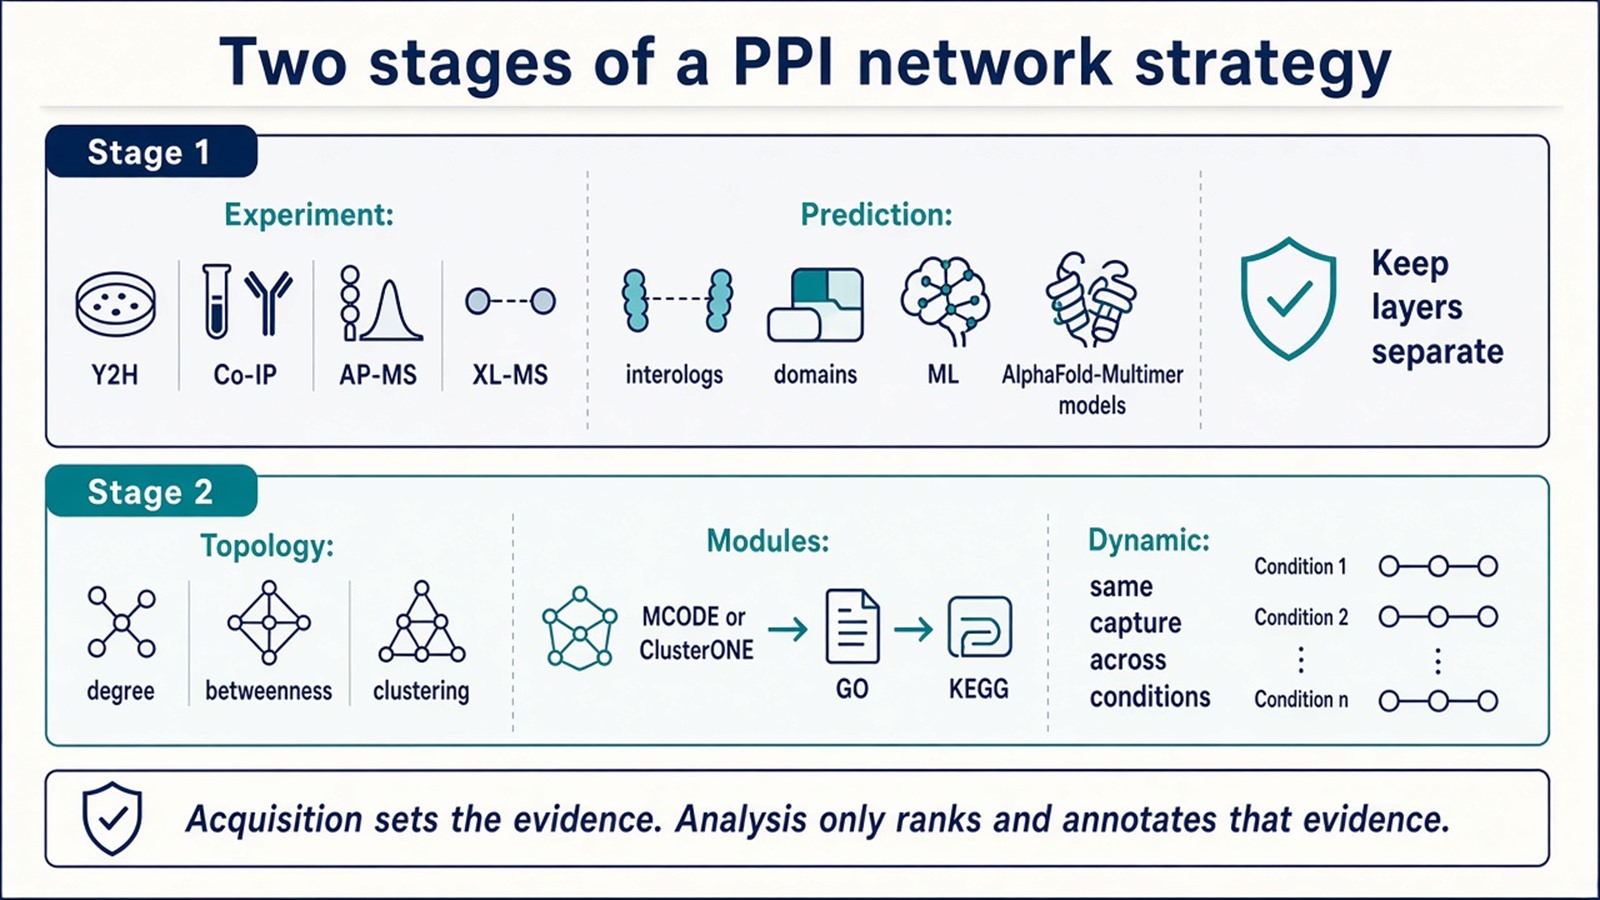
Figure 2. Acquisition sets the evidence class. Topology, MCODE or ClusterONE modules, and dynamic comparisons only rank and annotate that class.
Analysis Strategies After the Graph Exists
1. Topology
Degree counts edges on this graph and is used to flag hubs. Betweenness marks nodes that sit on many shortest paths. Clustering coefficient describes local density. All three describe the imported structure. High degree is not information-flow proof and is not a therapeutic-target score.
2. Modules and enrichment
MCODE and ClusterONE extract dense clusters. GO and KEGG then interpret the protein set. Modules are follow-up units. They are not demonstrated functional complexes.
3. Condition-specific or dynamic graphs
Time, tissue, or disease contrasts are valid only when the same capture chemistry is held across conditions. A static public STRING overlay with new colors is not a dynamic PPI network. For a hands-on STRING and Cytoscape path after the strategy is chosen, Tutorial on Protein-Protein Interaction Network Analysis and Visualization Tools provides stepwise software detail.
What Strategic Network Analysis Can Support
Neighbors of a known disease protein can be ranked for follow-up. In cancer models, a labeled graph can place proteins near a driver-associated pathway. That ranking is a shortlist, not a revealed pathogenic cascade.
Hubs are often discussed as points of network stability. Degree alone does not make them promising drug targets. PPI-inhibitor programs, including small molecules directed at pairs such as MDM2–p53, start from a defined, validated interface. A network can put that pair in neighborhood context. It does not, by itself, develop the inhibitor.
Transcript, metabolite, or phosphopeptide attributes can be stored on the same nodes. Integration helps reading. It does not enable predictive intervention or system-level control.
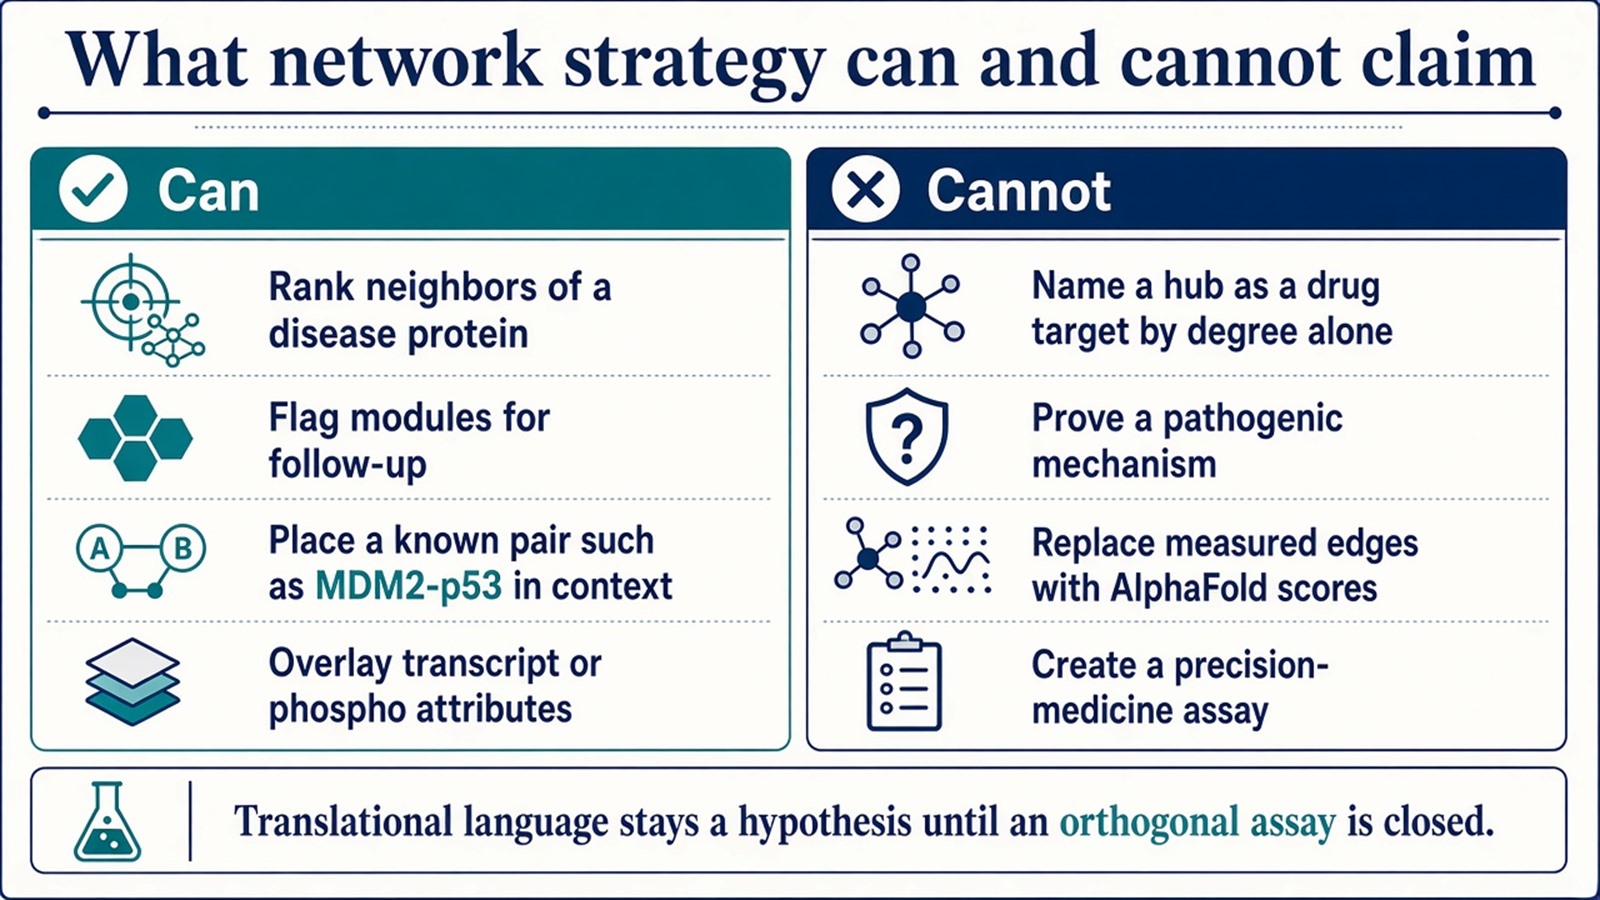
Figure 3. Strategy can rank neighbors, flag modules, and place a known pair such as MDM2–p53 in context. It cannot name a hub as a target or replace measured edges with a predicted structure.
Experimental Limits and Design Boundaries
Y2H, Co-IP, AP-MS, and XL-MS export different events. Prediction inherits training and database bias. Dynamic language requires matched capture. Diagnostic, biomarker, or precision-medicine claims sit outside ordinary research network strategy unless a separately validated assay framework is in place.
Project Planning and Service Scope
A usable strategy names the edge type, the acquisition method, the analysis layer, and which nodes return to a wet-lab check. MtoZ Biolabs scopes Co-IP, AP-MS, XL-MS, and tag-based enrichment on Orbitrap-class LC-MS/MS, then module detection and visualization after the experimental table is closed. Network software cannot recover a contact that capture did not retain.
Once the edge type, method, and analysis rule are defined, the project can be scoped as a PPI network study. Researchers can review the MtoZ Biolabs Protein-Protein Interaction Analysis Service for project-specific sample evaluation, feasibility assessment, and workflow planning.
Frequently Asked Questions
1. What is the first strategic choice in PPI network analysis?
Name whether edges will be direct binding or functional association, and whether they will be measured or predicted.
2. Does AP-MS report endogenous untagged interactions?
Not in the tagged format. AP-MS reports partners of an epitope-tagged bait. Native Co-IP or IP-MS is the untagged route.
3. Can AlphaFold-Multimer expand a network as if it were an experiment?
No. It proposes geometry. The pose is a hypothesis until a matched assay is closed.
4. Are hub proteins good drug targets because they have high degree?
No. Degree ranks the current graph. Target work still needs a defined interface and later pharmacology.
5. When is a condition-specific network actually dynamic?
When the same capture chemistry is run across time, tissue, or treatment, with matched controls. Recoloring a public graph is not sufficient.
Reference
- Fields S., Song O. (1989). A novel genetic system to detect protein-protein interactions. Nature, 340, 245-246. https://doi.org/10.1038/340245a0
- Gingras A.C., Gstaiger M., Raught B., Aebersold R. (2007). Analysis of protein complexes using mass spectrometry. Nat. Rev. Mol. Cell Biol., 8, 645-654. https://doi.org/10.1038/nrm2208
- Leitner A., Faini M., Stengel F., Aebersold R. (2016). Crosslinking and mass spectrometry: an integrated technology to understand the structure and function of molecular machines. Trends Biochem. Sci., 41, 20-32. https://doi.org/10.1016/j.tibs.2015.10.008
- Evans R., O'Neill M., Pritzel A., et al. (2022). Protein complex prediction with AlphaFold-Multimer. bioRxiv. https://doi.org/10.1101/2021.10.04.463034
- Bader G.D., Hogue C.W. (2003). An automated method for finding molecular complexes in large protein interaction networks. BMC Bioinformatics, 4, 2. https://doi.org/10.1186/1471-2105-4-2
- Vassilev L.T., Vu B.T., Graves B., et al. (2004). In vivo activation of the p53 pathway by small-molecule antagonists of MDM2. Science, 303, 844-848. https://doi.org/10.1126/science.1092472
