



In label-free quantitative (LFQ) proteomics data analysis, normalization is the step that places peptide or protein intensities from independently acquired liquid chromatography-tandem mass spectrometry (LC-MS/MS) runs onto a comparable scale before differential testing. After identification, feature extraction, and cross-run alignment, a normalization method removes systematic technical offsets such as loading differences and instrument drift under an explicit assumption about which signals should stay stable. It does not invent missing peptides, repair a confounded injection order, or convert LFQ intensities into calibrated absolute concentrations. Choose the method from the study design, then verify the result with distribution, principal component, and technical-spread checks before group contrasts are interpreted.
Researchers who already have defined samples, comparison groups, or a specific project objective can also review the MtoZ Biolabs Label-Free Quantitative Proteomics Service for project-specific feasibility and analysis planning.
Where Normalization Sits in LFQ Data Analysis
Unlabeled LFQ keeps each digest as its own LC-MS/MS run. Peptide identities come from fragment evidence. Quantitative values usually come from MS1 peak areas, or from fragment chromatograms when the unlabeled digest was acquired as data-independent acquisition (DIA). Software matches features across runs, summarizes peptides to proteins, and only then should statistical contrasts be tested.
Normalization belongs after alignment and intensity extraction, and before or together with protein-level summarization, depending on the pipeline. Running differential tests on raw, unscaled intensities confuses technical scale with biology. Applying aggressive distribution matching after groups are already confounded with run order can hide the design problem without repairing it.
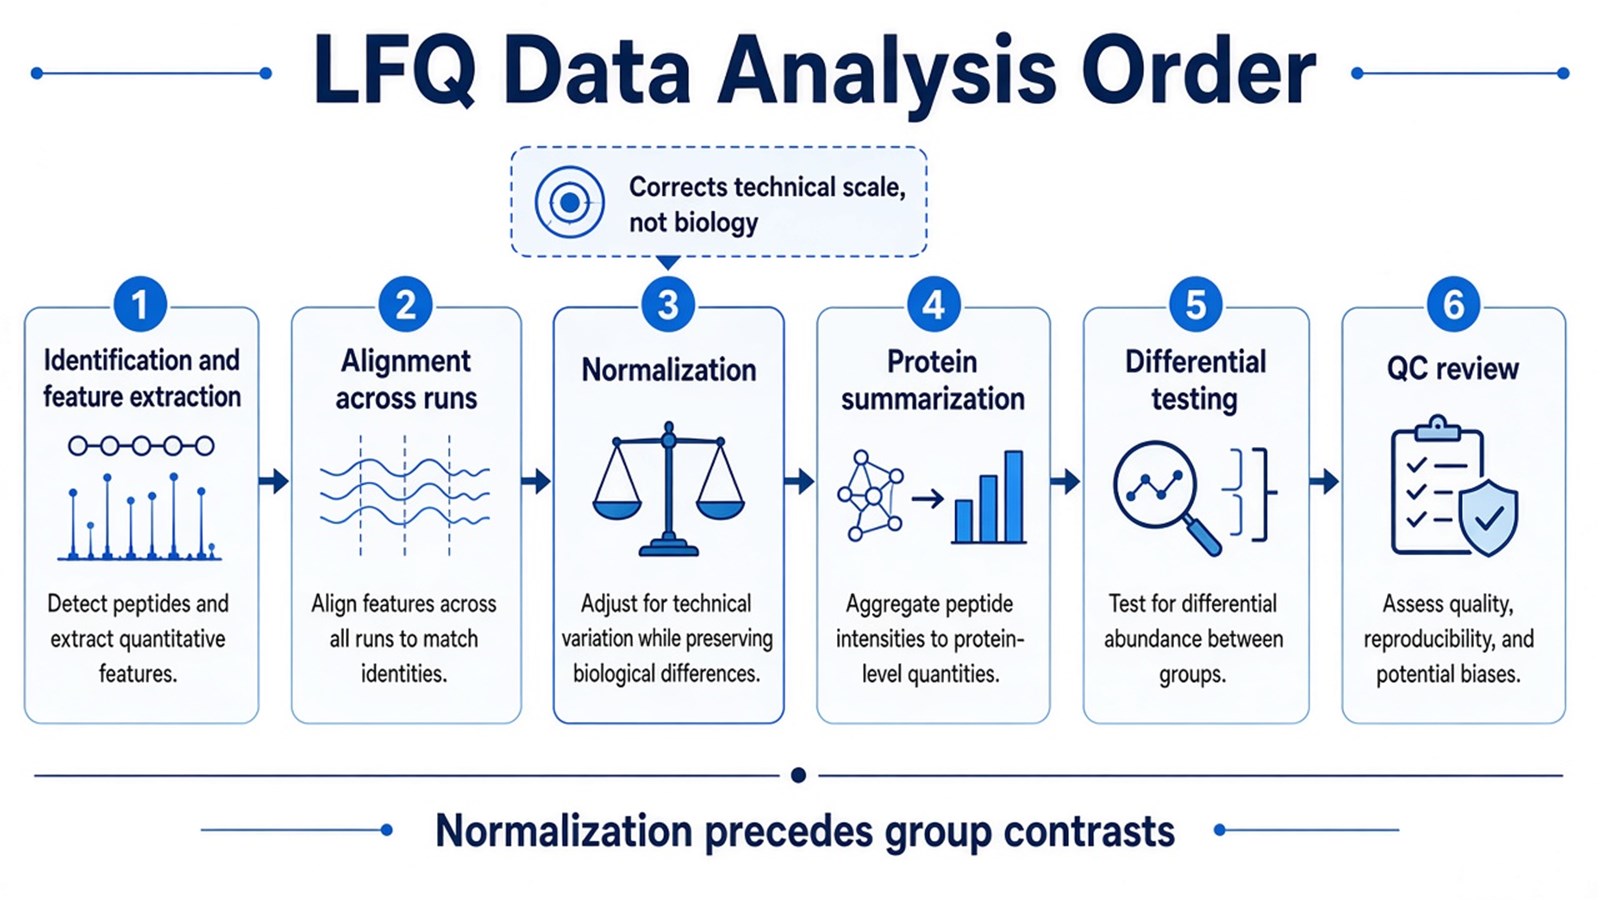
Figure 1. In LFQ data analysis, normalization corrects technical scale after alignment and before group contrasts are interpreted.
Normalization makes intensities more comparable across runs; it does not prove that a protein change is biological.
Why Label-Free Intensities Need Scaling
Independent injections carry separate loading, chromatography, spray, and detector histories. Common technical biases include unequal total peptide load, declining column performance across a sequence, ionization drift, and batch structure tied to acquisition date. Without scaling, those offsets can dominate apparent fold changes.
Normalization assumes that a defined part of the intensity structure is technical rather than biological. That assumption must match the experiment. If most of the proteome is expected to shift, forcing every sample to the same total intensity can remove part of the real signal. If only a minority of proteins change, centering on a robust central tendency is often reasonable.
Common Normalization Methods and Their Assumptions
Method |
What it does |
Core assumption |
Typical caution |
|---|---|---|---|
Total ion current (TIC) |
Scales each run so totals match a reference |
Overall signal should be similar across samples |
Poor fit when global abundance truly shifts |
Median normalization |
Aligns sample medians |
Most proteins are unchanged |
Extreme global remodeling can violate the assumption |
Quantile normalization |
Forces identical intensity distributions |
Samples should share the same intensity shape |
Can over-constrain heterogeneous biological groups |
Reference proteins or spike-ins |
Scales to stable endogenous or added standards |
Chosen references are stable and well measured |
Bad references transfer their bias to the matrix |
MaxLFQ / delayed normalization |
Uses peptide ratio structure across samples (Cox et al. 2014) |
Pairwise peptide ratios can anchor relative scales |
Stay inside the stated MaxQuant or equivalent workflow |
Method reviews in label-free proteomics emphasize that no single normalizer is universally best; performance depends on the fraction of changing proteins and on missingness (Valikangas et al. 2018). When MaxQuant LFQ intensities are the quantitative object, retaining the built-in MaxLFQ logic is usually preferable to replacing those values with an unrelated global scaler without justification.
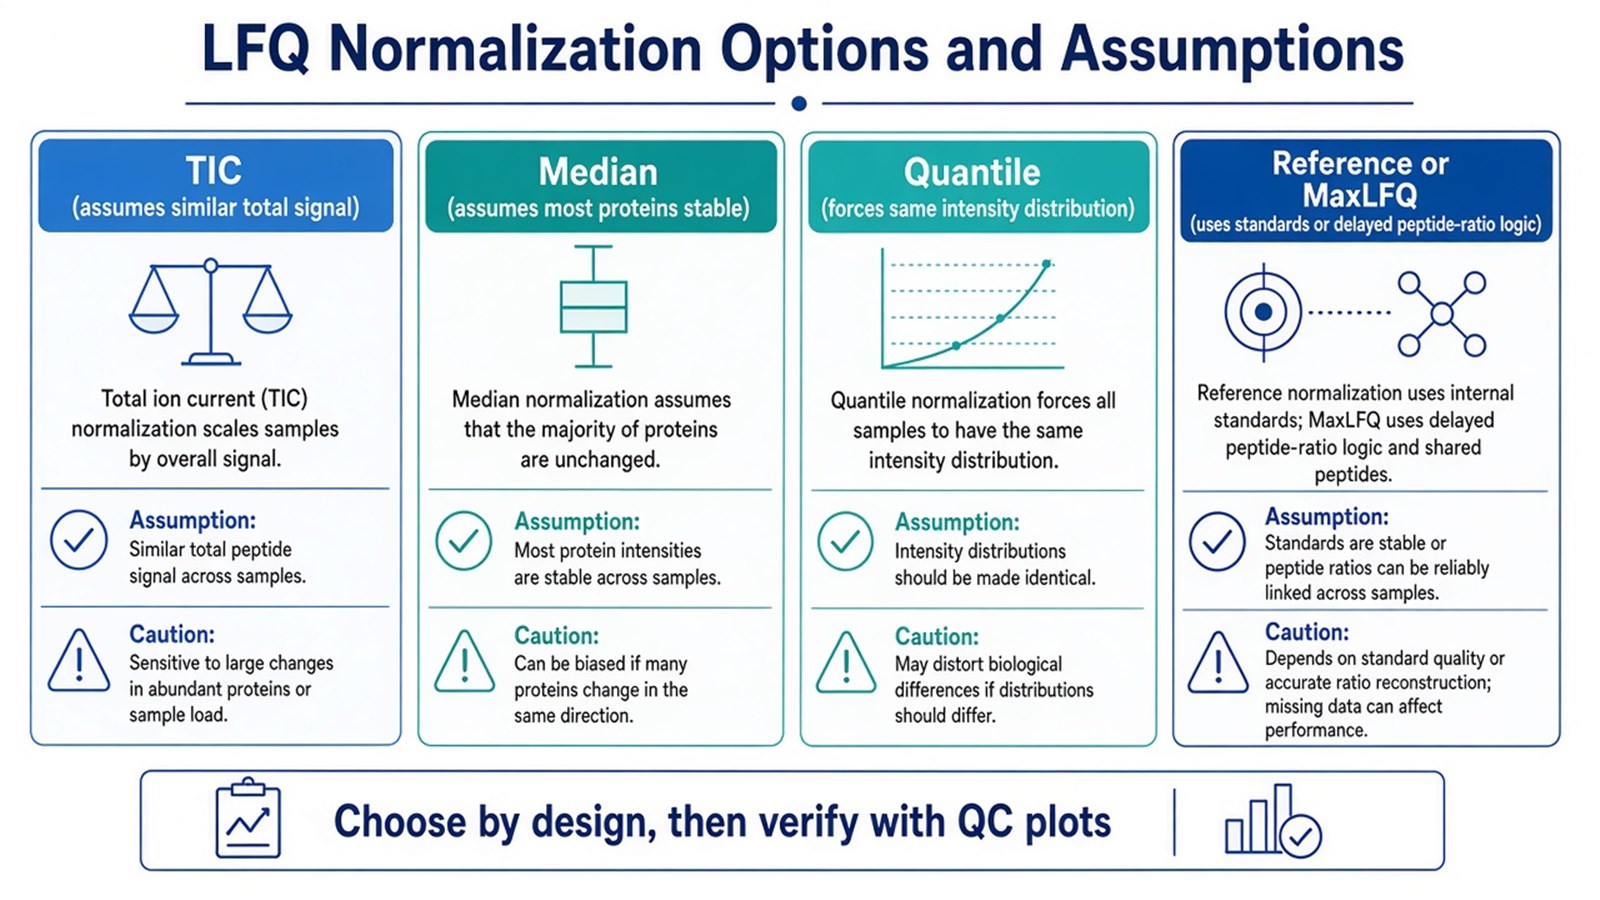
Figure 2. Each LFQ normalization option encodes an assumption about which intensity structure is technical; the method must match the design before QC plots are trusted.
How to Choose a Normalization Strategy
Selection starts from the biological design, not from a software default alone.
If only a minority of proteins are expected to change and loads were matched, median or MaxLFQ-style approaches are often reasonable starting points. If a strong global proteome shift is part of the biology, avoid blindly equalizing totals with TIC or forcing identical quantiles without checking whether the contrast of interest is attenuated. If stable references or carefully chosen spike-ins exist, reference-based scaling can anchor the matrix, provided those references are quantified cleanly. For long sequences or multiple acquisition blocks, inspect batch structure first; normalization can reduce scale differences, but it cannot legitimately merge incompatible chromatographic regimes.
After the method is applied, inspect intensity distributions or boxplots, principal component analysis (PCA) for group versus batch separation, and the spread of repeated quality-control or technical signals. Coefficient of variation (CV) summaries can show whether technical scatter narrowed. They are not acceptance thresholds by themselves, and they do not validate biological calls.
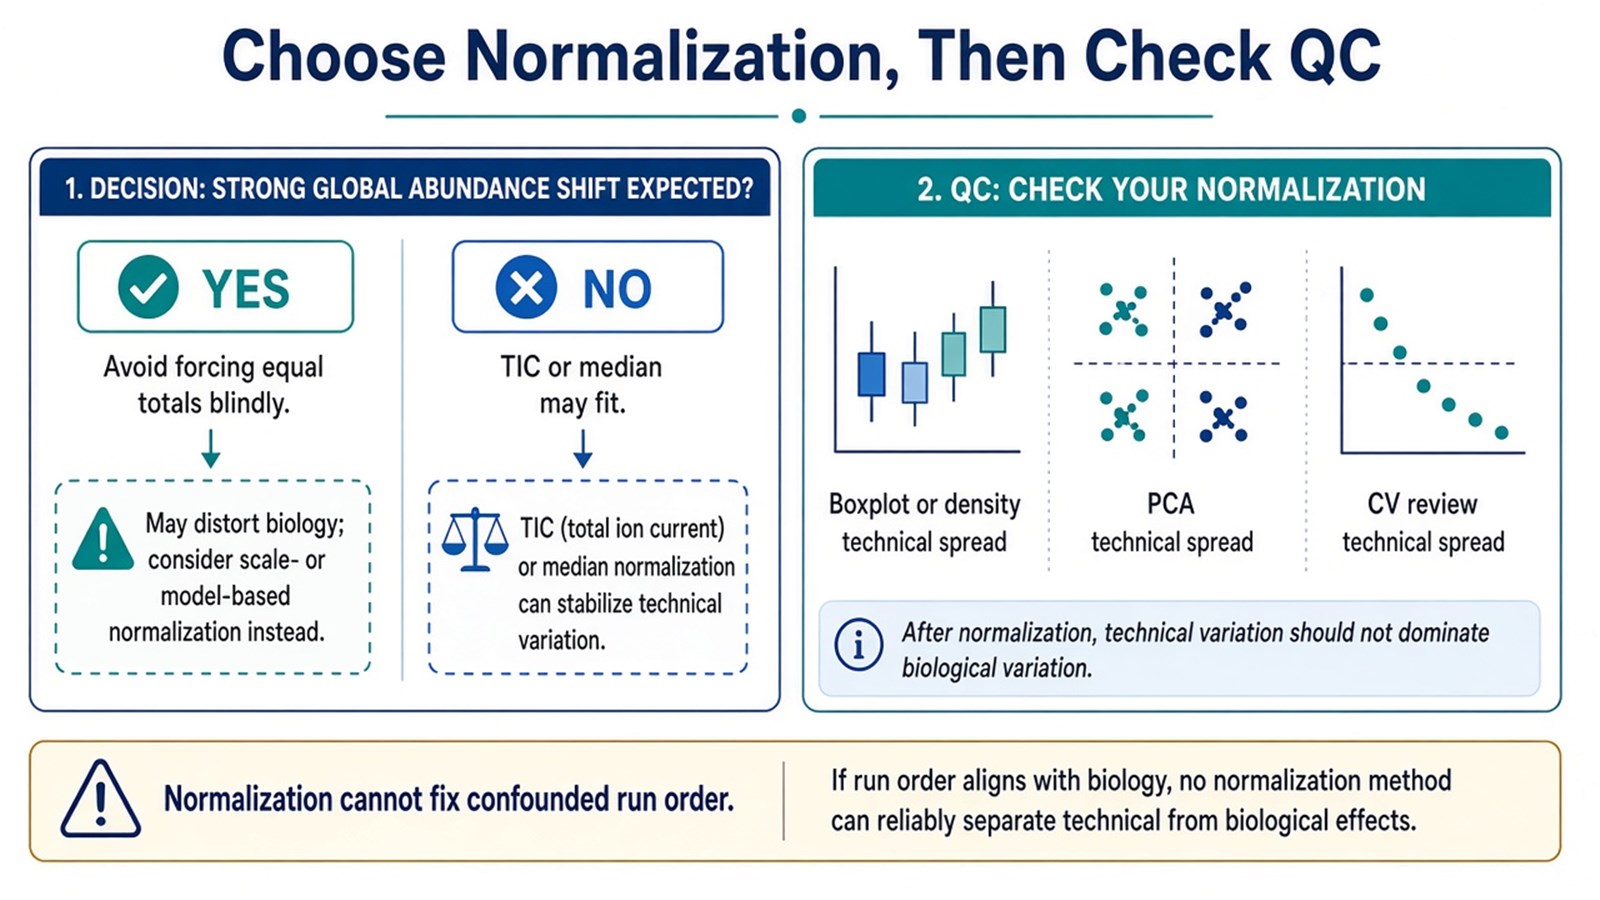
Figure 3. Choose normalization from the expected global-shift pattern, then confirm with distribution, PCA, and technical-spread QC; normalization cannot fix confounded run order.
LFQ Judgment Limits Around Normalization
Normalization is only one LFQ decision. The unlabeled claim remains relative change of the same protein across comparable runs. Ordinary LFQ intensities should not rank different proteins by molar amount. Missing values remain expected in unlabeled data-dependent acquisition (DDA); imputation inserts a model-based number and must be disclosed. DIA can change completeness and the extracted signal type, but it does not remove the need for a declared scaling plan.
Injection order should keep biological groups from aligning with instrument time. Quality-control injections monitor drift. They do not rescue a design in which all controls were acquired before all treated samples. Researchers who need the broader unlabeled discovery frame can refer to What Is Label-Free Quantification in Proteomics? for LFQ fit, missingness, and interpretation limits beyond normalization.
Application Contexts Where Normalization Choices Matter
Normalization decisions become critical in tissue-state comparisons with large remodeling, time-course or dose series where drift accumulates across many injections, and multi-batch clinical cohorts where acquisition date can mimic phenotype. In each case, the analysis report should name the normalizer, its assumption, and the QC plots used to accept it. Pathway enrichment on a post-normalization candidate list still reflects overrepresentation relative to a quantified background. It does not prove pathway activity.
Once the comparison design, unlabeled acquisition plan, and normalization assumption are defined, the project can be evaluated as an LFQ study with a documented data-analysis path. Researchers can review the MtoZ Biolabs Label-Free Quantitative Proteomics Service for sample evaluation, feasibility assessment, and workflow planning.
Frequently Asked Questions
1. Where does normalization sit in LFQ data analysis?
After identification, intensity extraction, and cross-run alignment, and before final interpretation of group contrasts. Exact placement relative to protein summarization depends on the software workflow and should be reported.
2. Is MaxQuant LFQ already normalized?
MaxLFQ applies a delayed normalization based on peptide ratios across samples (Cox et al. 2014). If those LFQ intensities are used, replacing them with an unrelated global method needs a stated reason.
3. Can normalization remove batch effects completely?
No. It can reduce scale differences. Confounded design, column changes, or incompatible blocks may remain visible on PCA and should be modeled or separated analytically.
4. Does better-looking QC after normalization guarantee correct biology?
No. QC shows improved technical comparability. Biological truth still depends on design, peptide evidence, missingness handling, and the statistical model.
5. Can normalization create absolute protein amounts?
No. Absolute or copy-number claims need matched standards and a calibration model. Normalization only rescales relative intensities inside the study.
Reference
- J. Cox, M.Y. Hein, C.A. Luber, I. Paron, N. Nagaraj, M. Mann (2014). Accurate proteome-wide label-free quantification by delayed normalization and maximal peptide ratio extraction, termed MaxLFQ. Mol. Cell. Proteomics, 13, 2513-2526. https://doi.org/10.1074/mcp.M113.031591
- T. Valikangas, T. Suomi, L.L. Elo (2018). A systematic evaluation of normalization methods in quantitative label-free proteomics. Brief. Bioinform., 19, 1-11. https://doi.org/10.1093/bib/bbw095
