



How to build and analyze a protein–protein interaction (PPI) network starts from the edge source, not from a layout. Nodes are proteins. Edges are reported contacts. Those edges are either measured in the present study—yeast two-hybrid (Y2H), affinity purification–mass spectrometry (AP-MS), or crosslinking mass spectrometry (XL-MS)—or imported from STRING, BioGRID, or IntAct onto a protein list. The two graphs can look similar in Cytoscape. They do not support the same sentence. Analysis then ranks nodes, finds modules, and runs enrichment on those modules. Topology does not upgrade a text-mined STRING score into a sample-level interaction.
PPI networks are used to inspect functional neighborhoods, reconstruct signaling hypotheses, and prioritize proteins for later assays. They do not, by themselves, identify therapeutic targets or biomarkers. A high-quality network is one whose edge type is stated and whose controls match that type. It is not a denser picture.
Researchers who already have a bait panel, a differential proteomics list, or a project objective can also review the MtoZ Biolabs Protein-Protein Interaction Analysis Service for project-specific feasibility and analysis planning.
Two Strategies for Building a PPI Network
1. Experimental acquisition of edges
Y2H screens binary pairs at library scale and is useful for unknown partners. The edge is nuclear reconstitution in yeast.
AP-MS immuno-enriches a bait and identifies proteins that remain associated under the stated lysis and wash. The edge is co-purification in a cellular background, not a resolved assembly state.
XL-MS covalently links proximal residues and identifies crosslinked peptides. The edge is a spatial constraint at the time of crosslinking.
These three methods build an experimental graph. For evidence-type detail on AP-MS and XL-MS, How to Identify Protein–Protein Interactions Using Mass Spectrometry provides a more detailed explanation of experimental limits.
2. Database integration onto a protein list
When a TMT, DIA, or other proteomics list already exists, STRING, BioGRID, and IntAct can place public edges among those proteins. STRING mixes experimental records, prediction, and text mining and reports a combined score. BioGRID and IntAct are richer in curated experimental literature and consortium records. Neither route constructs an accurate interactome of the current sample. The product is an association graph among proteins that changed, or were detected, in the study. For how those database layers should stay separate from measured edges, Protein-Protein Interaction Mapping Methods and Applications provides a more detailed discussion of mapping layers.
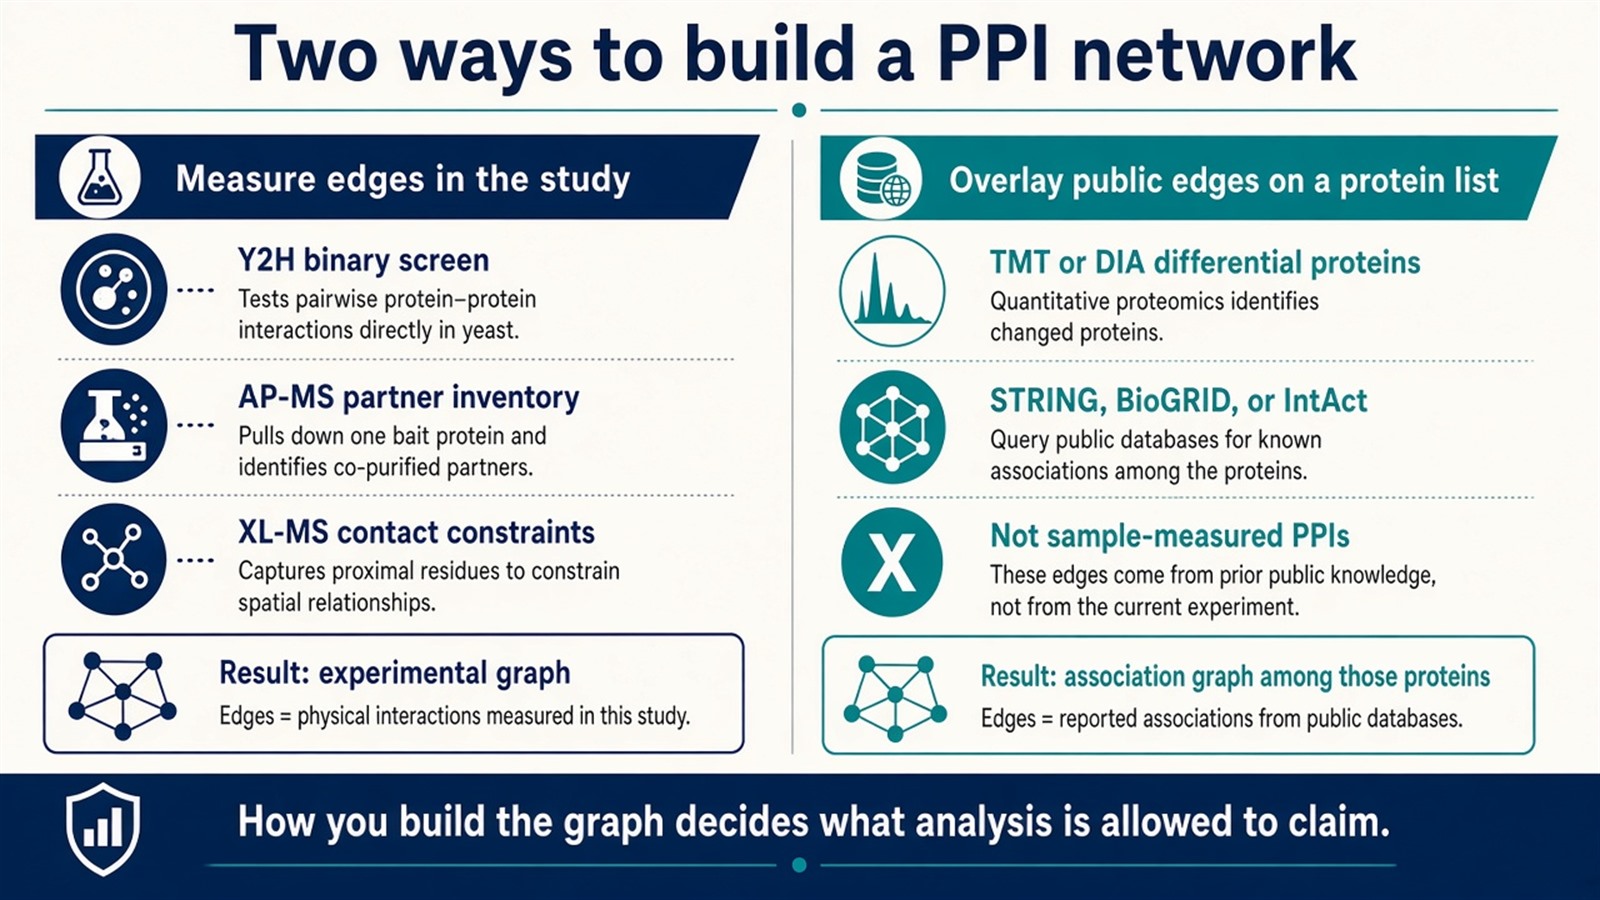
Figure 1. Building a network either measures edges in the study or overlays public associations on a protein list. The second path is not an AP-MS interactome of the sample.
Name the edge source before opening Cytoscape. Analysis cannot repair an unlabeled mix of measured and imported contacts.
Strategies for Analyzing a PPI Network
1. Network topology
Degree counts how many edges touch a node on this graph. TP53 and AKT1 are frequent high-degree proteins in public cancer maps. That literature status does not make every high-degree node in a user graph a critical regulator.
Betweenness and closeness can flag proteins that sit on many shortest paths in the imported structure. Density and clustering coefficient describe how tightly the current edge set is packed. All of these metrics describe the graph that was drawn. They do not prove a signaling-bridge function.
2. Module identification
Cytoscape plugins such as MCODE or ClusterONE find densely connected clusters. Those clusters are candidates for follow-up as possible complexes or pathway neighborhoods. They are not demonstrated cooperative assemblies until an orthogonal assay is closed.
3. Functional enrichment
Gene Ontology (GO) and KEGG analysis on a module interpret the protein set. Enrichment does not validate the edges that placed those proteins together. A pathway hit on a STRING-derived module is a hypothesis about the list, not proof that the contacts occur in the sample.
For which desktop tool fits layout, plugins, or topology, What Is Protein-Protein Interaction (PPI) Network Visualization? Recommended Tools and Software provides a more detailed comparison of STRING, Cytoscape, and Gephi.
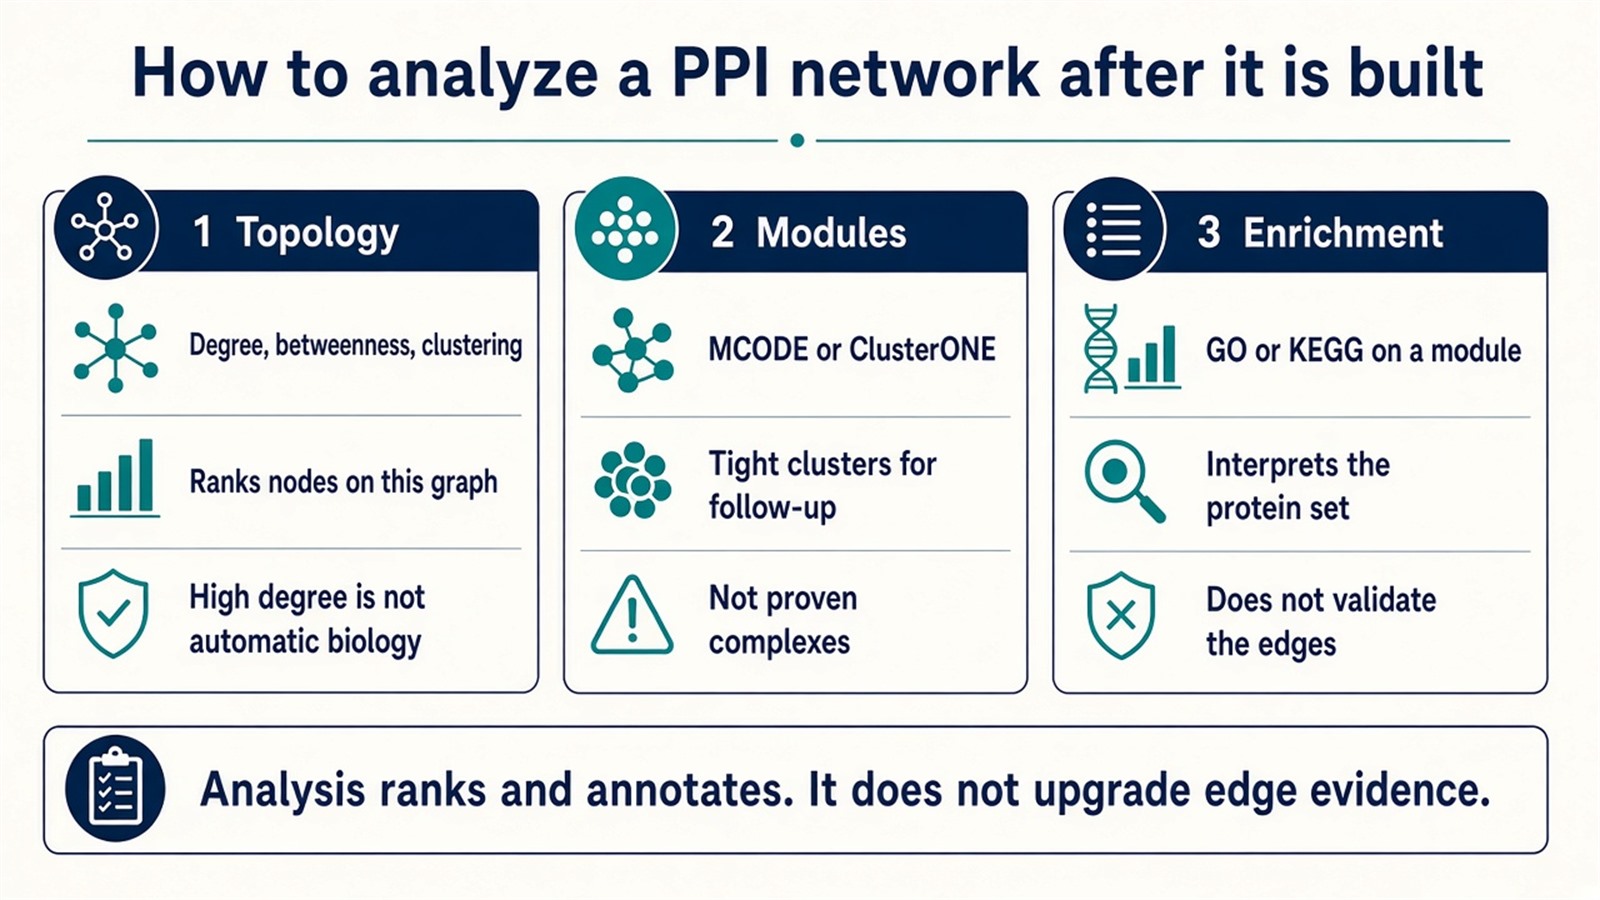
Figure 2. Topology, modules, and enrichment rank and annotate the current graph. They do not upgrade the evidence class of its edges.
What Built Networks Are Used For
1. Disease-mechanism hypotheses
In cancer studies, a network drawn from tumor proteomics plus public edges can rank nodes that sit near proliferation, immune, or microenvironment terms. The ranking is a shortlist. It does not identify the proteins that regulate those processes in that tissue unless the edges were measured there.
2. Target nomination and combination hypotheses
Placing known drug targets on a graph and inspecting neighbors can suggest proteins or paths to test next. Neighbor status is not an indirect target and is not a combination-therapy rationale until pharmacology is done.
3. Prioritizing proteins after a differential list
Not every differentially abundant protein will be followed. Proteins that also sit in a dense, labeled module can be ranked earlier for validation. Module membership does not increase biomarker diagnostic accuracy and does not make a protein biologically meaningful by itself.
Practical Workflow: From Proteomics Lists to a Draft Network
A common academic and R&D path is:
Identify differentially abundant proteins from a TMT or DIA experiment.
Standardize identifiers to UniProt accessions or gene symbols.
Draft a preliminary network in STRING among those proteins.
Move the graph to Cytoscape for layout, attributes, and MCODE or ClusterONE modules.
Run GO or KEGG on selected modules to write the next mechanistic sentence.
This path overlays known or predicted contacts on a quantitative protein list. When the next sentence needs measured edges, the study still requires Y2H, AP-MS, or XL-MS on the same biological question.
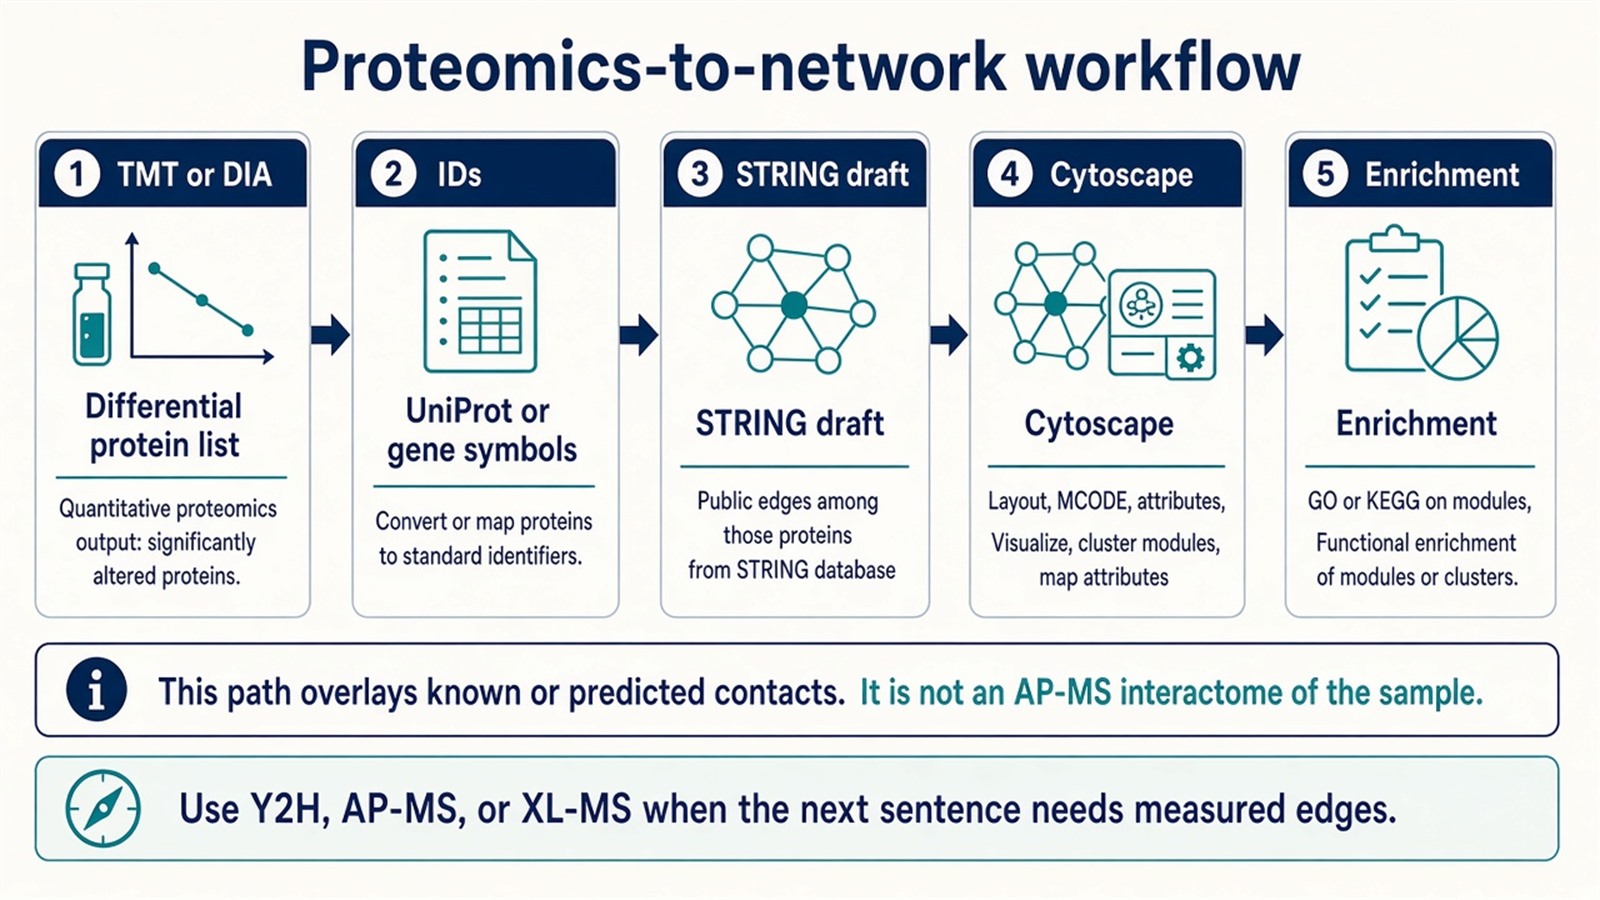
Figure 3. A typical proteomics workflow drafts a STRING neighborhood among differential proteins, then analyzes modules in Cytoscape; the edges remain public associations unless an experimental PPI assay is added.
Experimental Limits and Design Boundaries
Y2H, AP-MS, and XL-MS each export a different edge type. STRING will mix channels unless they stay visible. BioGRID and IntAct report published experiments, not the current lysate. High degree on TP53-class nodes is often a property of public graphs. Diagnostic, repositioning, or biomarker-accuracy claims sit outside ordinary research network analysis unless a separately validated assay framework is in place.
Project Planning and Service Scope
A usable plan names whether the graph will be measured or overlaid, the identifier map, the Cytoscape rule for modules, and which nodes return to a wet-lab check. MtoZ Biolabs scopes TMT or DIA quantification, AP-MS or XL-MS when measured edges are required, Orbitrap-class LC-MS/MS detection, and subsequent network annotation after the table is closed. A STRING draft cannot recover a contact that was never measured.
Once the build route, analysis rule, and follow-up nodes are defined, the project can be scoped as a PPI network study. Researchers can review the MtoZ Biolabs Protein-Protein Interaction Analysis Service for project-specific sample evaluation, feasibility assessment, and workflow planning.
Frequently Asked Questions
1. Does a STRING network of TMT or DIA hits equal a measured PPI network?
No. It places public associations among proteins that changed in abundance. Sample-level edges still need Y2H, AP-MS, or XL-MS.
2. Are high-degree proteins automatically disease hubs?
No. Degree describes the current graph. TP53 or AKT1 may be hubs in public cancer maps and still need sample-level evidence in the study at hand.
3. Do MCODE modules prove protein complexes?
No. They flag dense clusters for follow-up. Complex membership needs an orthogonal biochemical or MS design.
4. Should BioGRID or IntAct replace STRING for a more accurate network?
They change the evidence mix, usually toward curated literature. They still do not measure the current sample.
5. Can network analysis identify biomarkers or drug-repositioning opportunities?
It can prioritize proteins or neighbors to test. It does not establish a biomarker or a combination regimen.
Reference
- Shannon P., Markiel A., Ozier O., et al. (2003). Cytoscape: a software environment for integrated models of biomolecular interaction networks. Genome Res., 13, 2498-2504. https://doi.org/10.1101/gr.1239303
- Szklarczyk D., Gable A.L., Lyon D., et al. (2019). STRING v11: protein-protein association networks with increased coverage, supporting functional discovery in genome-wide experimental datasets. Nucleic Acids Res., 47, D607-D613. https://doi.org/10.1093/nar/gky1131
- Bader G.D., Hogue C.W. (2003). An automated method for finding molecular complexes in large protein interaction networks. BMC Bioinformatics, 4, 2. https://doi.org/10.1186/1471-2105-4-2
- Gingras A.C., Gstaiger M., Raught B., Aebersold R. (2007). Analysis of protein complexes using mass spectrometry. Nat. Rev. Mol. Cell Biol., 8, 645-654. https://doi.org/10.1038/nrm2208
- Fields S., Song O. (1989). A novel genetic system to detect protein-protein interactions. Nature, 340, 245-246. https://doi.org/10.1038/340245a0
- Leitner A., Faini M., Stengel F., Aebersold R. (2016). Crosslinking and mass spectrometry: an integrated technology to understand the structure and function of molecular machines. Trends Biochem. Sci., 41, 20-32. https://doi.org/10.1016/j.tibs.2015.10.008
